


Trading charts for Tuesday, March 28th

Good morning and Happy Tuesday,
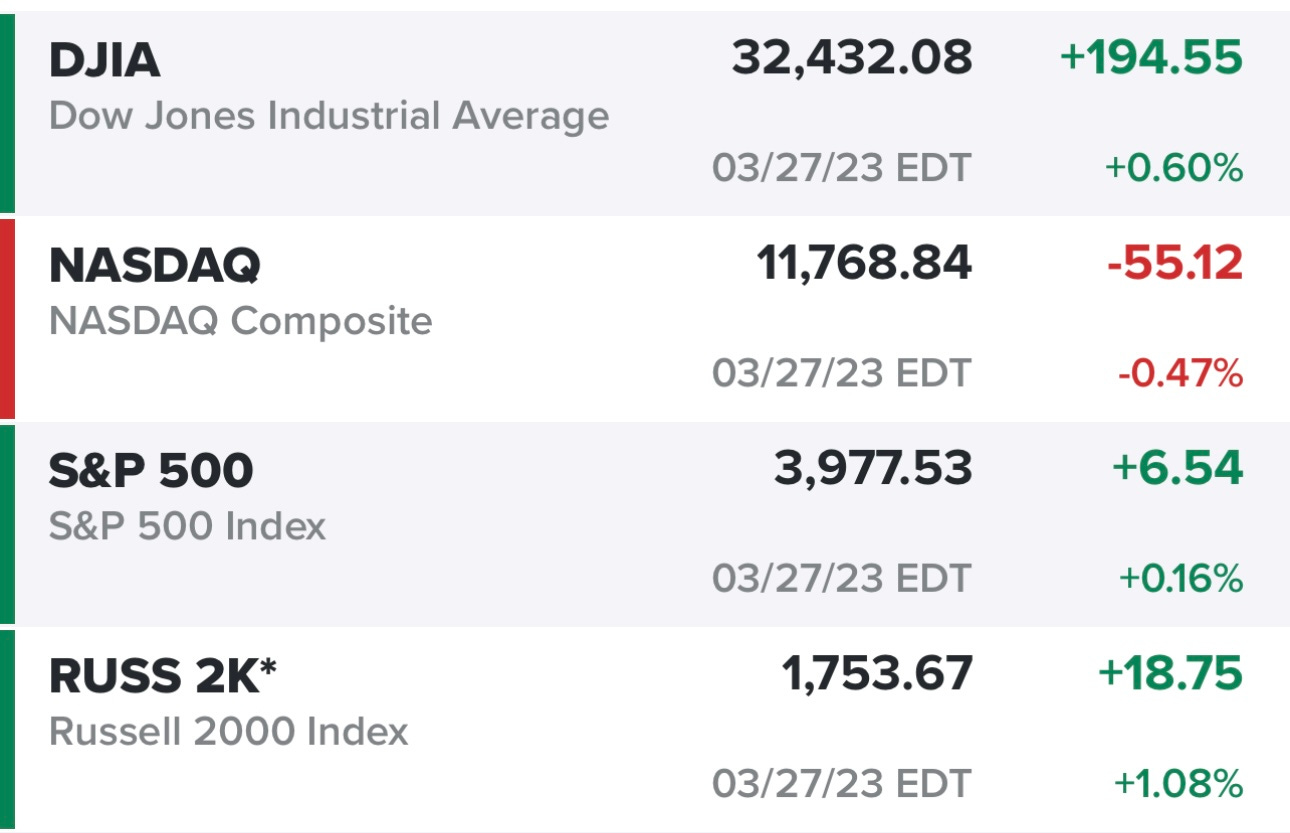
Yesterday was a slightly positive day in the markets however mega cap tech is starting to underperform versus SPY (market cap weighted S&P 500) and SPY is starting to underperform RSP (equal weighted S&P 500) which means the other 490+ stocks in the S&P are showing some relative strength vs AAPL GOOG MSFT AMZN etc but just to keep things in perspective QQQ is still up 15.9% YTD while SPY is only up 3.6% YTD and RSP is actually down -1.2% YTD — this is something to watch because we might continue to see money rotating out of mega cap tech and into the sectors that have really lagged in 2023 like energy, financials, healthcare, industrials, materials, etc. — I am not making this call, just pointing out what might happen. Here’s a chart of what the individual sectors have done so far in 2023 — kudos to anyone that was long tech and short energy :)

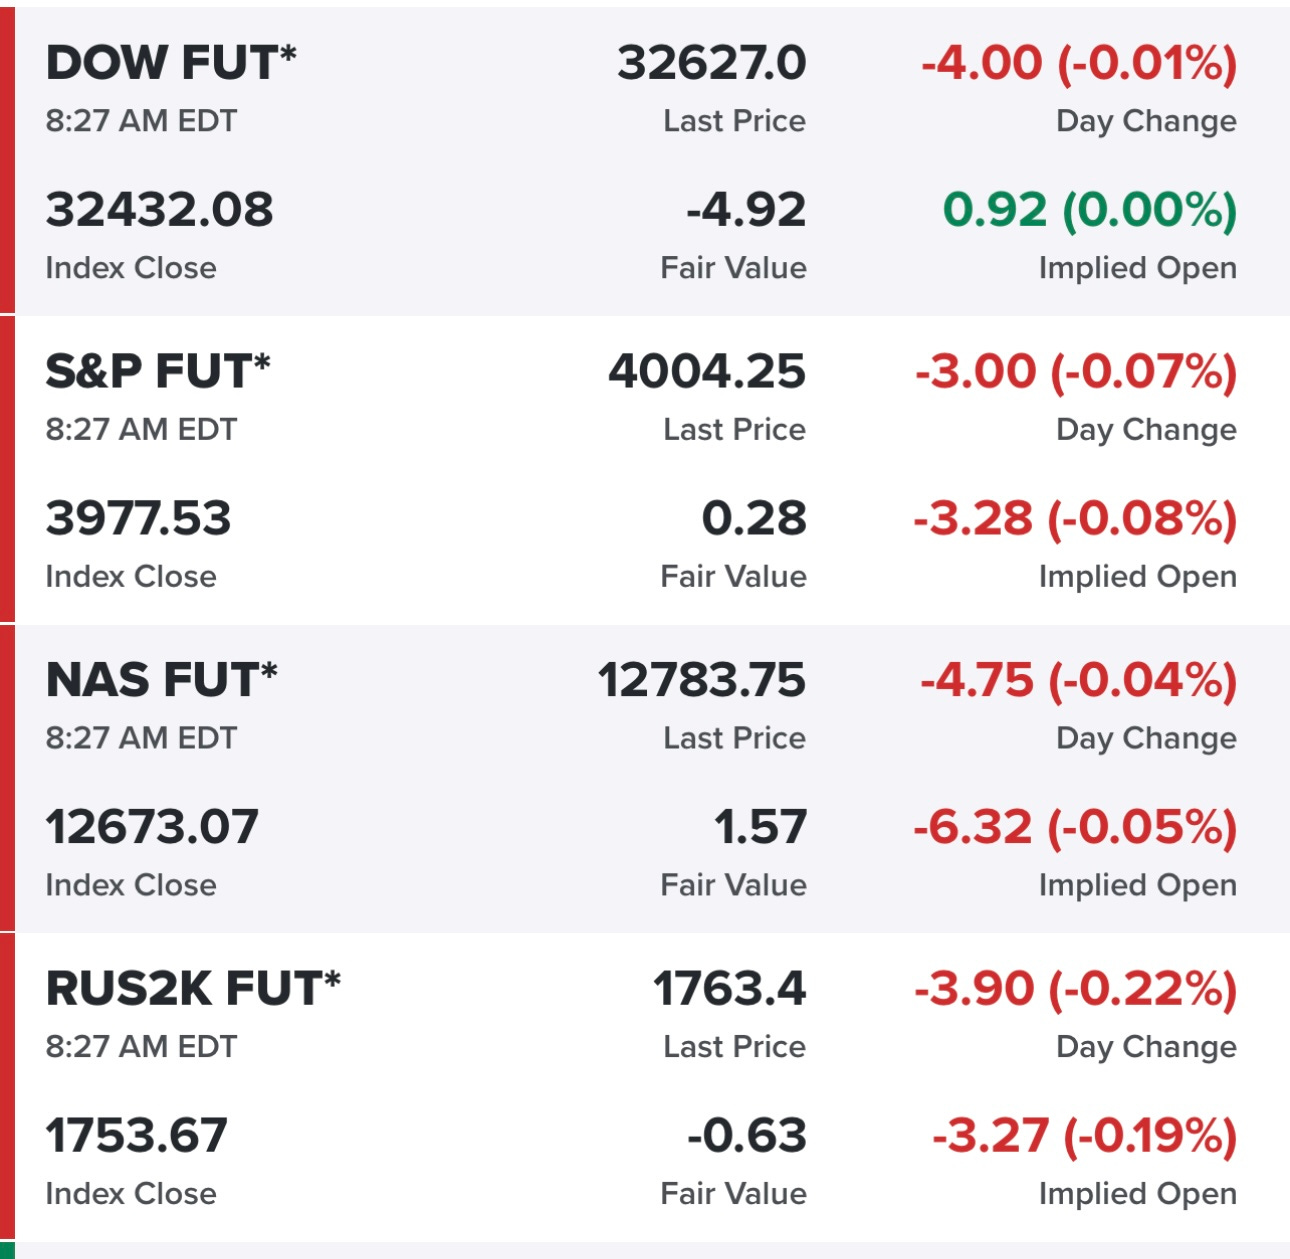
Futures are super flat as of 8:30am EST but we know that can change pretty fast. A few newsworthy items this morning starting with reports that BABA might be splitting up in 6 different companies.
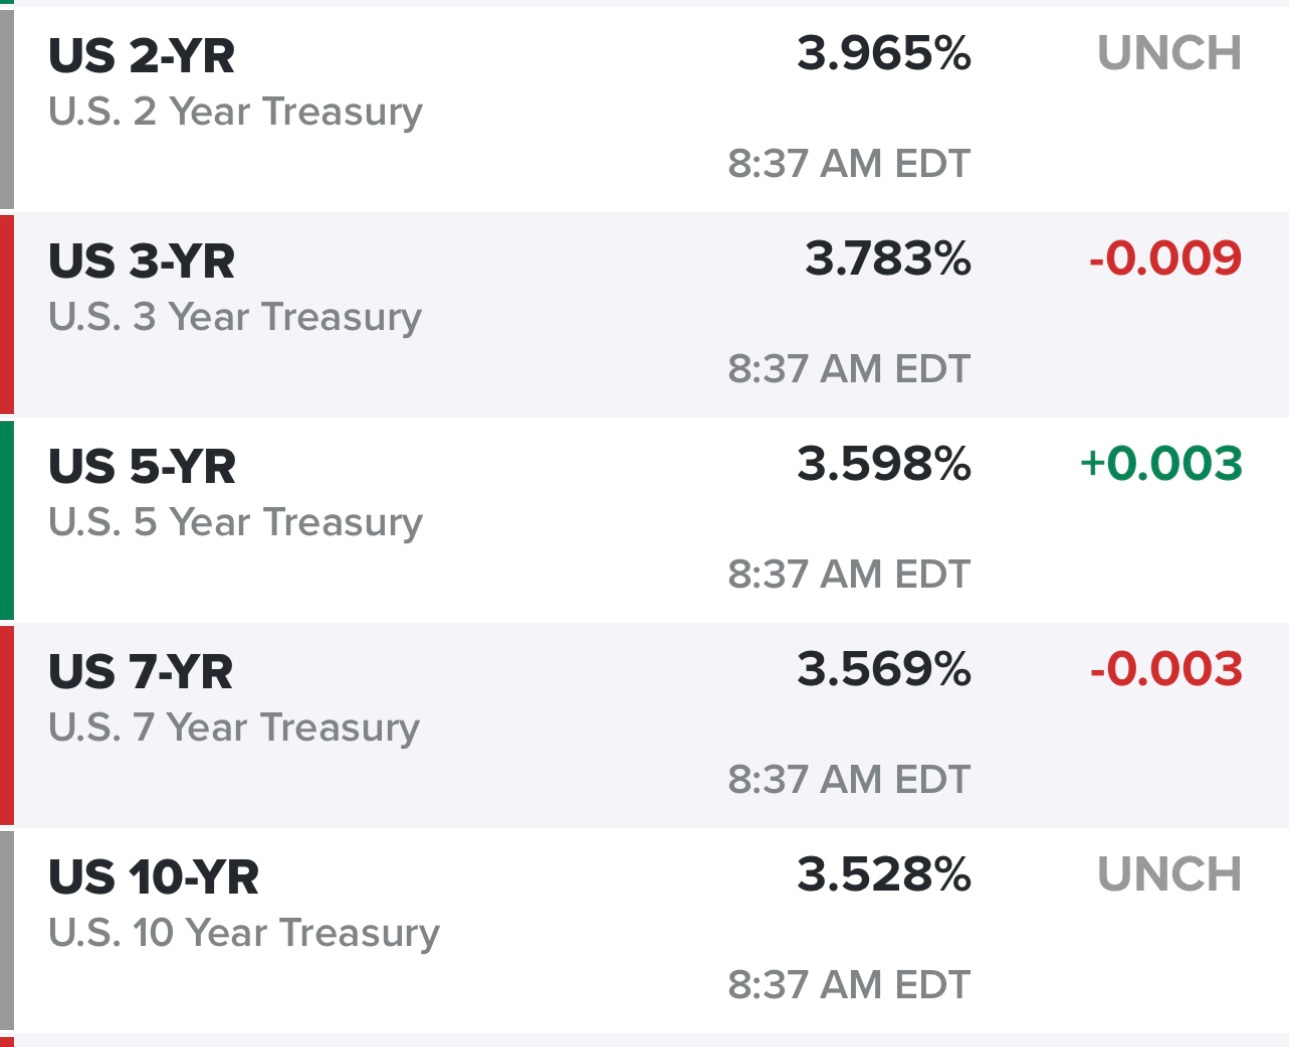
Yields also very flat this morning which is not what we’ve been seeing the past couple weeks since the bank issues popped up…
According to the CME fed watch tool there’s currently a 55% chance of no rate hike in in May and 45% chance of 25 bps rate hike.
I ran a stock screen this morning for companies expected to grow revenues by 24% for each of the next 3 years (2023, 2024, 2025) with positive net income (non-GAAP) in 2024 and 2025 with a stock price above $4 per share:
AGL ALVO AMLX AMPS ARES
BILL CAPR CELH CFLT CHRS
CTIC CRWD DDOG DLO ENFN
EOLS FLNC FLUX FLYW FOUR
FSR GLBE GSHD HIMS INDI
IOT IPWR MDWT MLCO MNKD
MOND NET NFE NU OLK
ONON PGNY SHLS SNOW SPT
SRPT THRN XMTR ZS