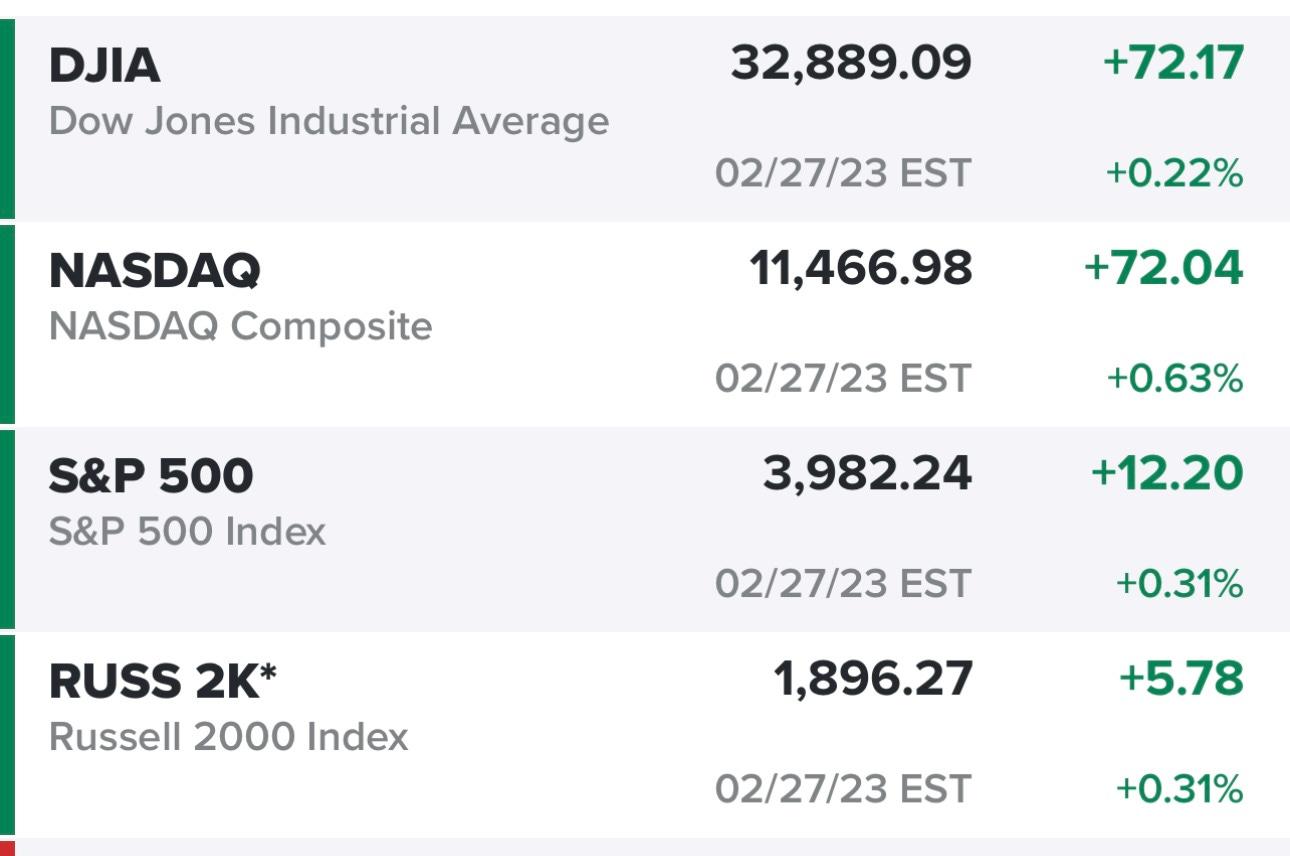
Trading charts for Tuesday, Feb 28th
In addition to this newsletter I have another newsletter on Substack called Jonah’s Deep Dives where I publish a weekly deep dive writeup (8,000+ words) on different growth stocks. Subscribe at deepdives.luptoncapital.com
I currently run the largest Stocktwits room where I post nonstop about my investment portfolio and trading portfolio including access to my daily activity, market commentary, investment models, daily webcasts and much more. Subscribe at stocktwits.luptoncapital.com
Recently I launched Disciplined Growth Investor on Seeking Alpha which is a combination of both Substack newsletters and my Stocktwits room but in one place to make things more streamlined. Subscribe at seekingalpha.luptoncapital.com
Good morning and Happy Tuesday,
All of the major indexes finished in the green yesterday but way off their morning highs, for instance the Dow finished up +72 points but it was up +300 points at one point in the day.
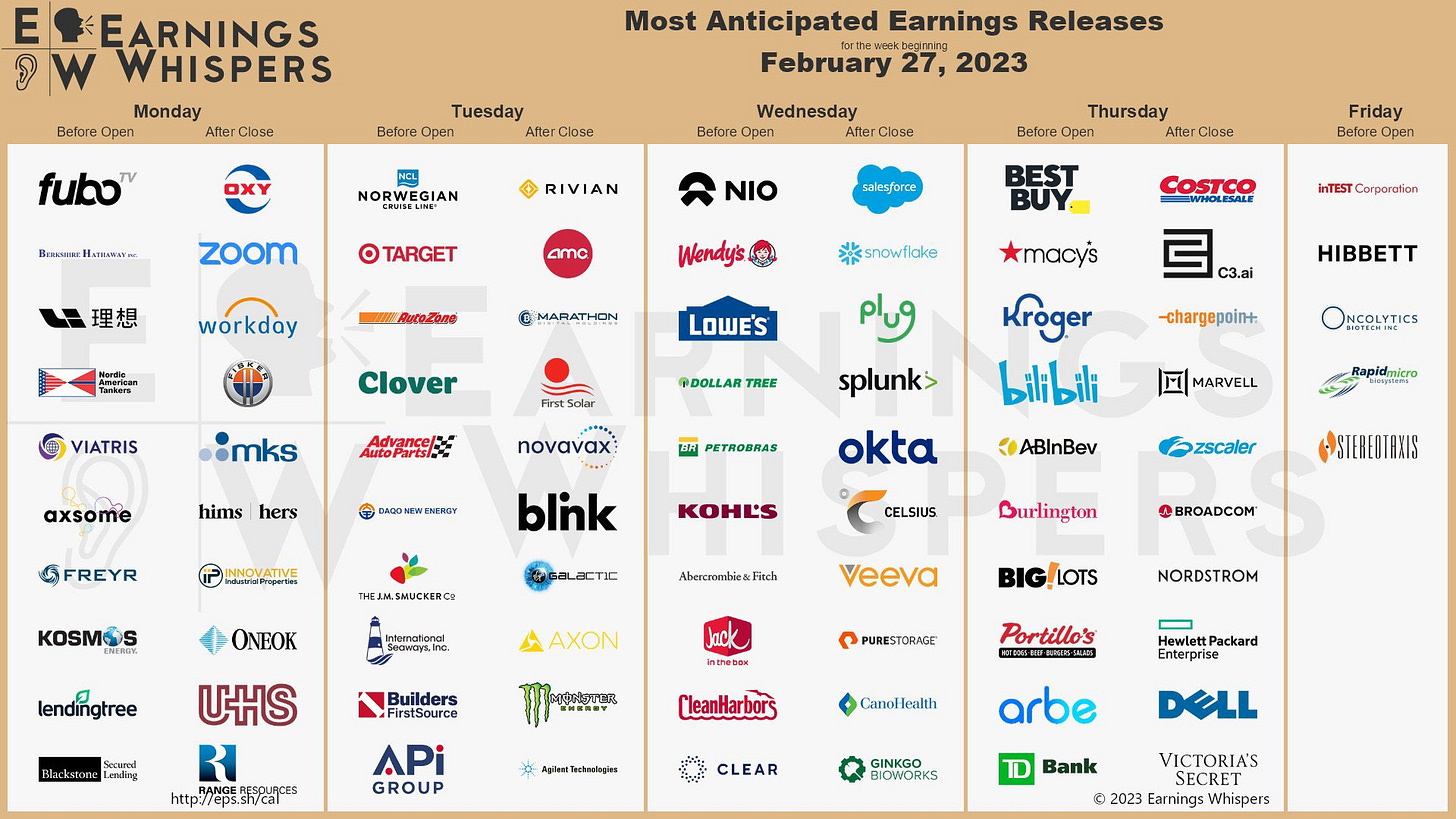
As of 6am EST, the futures are in the green with the 10Y yield hovering around 3.93% which is slightly lower than the highs from yesterday morning. We’re still in earnings season with lots of small/mid cap stocks reporting this week plus some of the larger retail names like TGT LOW and COST.
FWIW, I have 25% of my investment portfolio reporting this week 🤣
I still don’t have an abundance of faith that we’re in a new bull market but I’m also not sure this recent move back to 4000 was just a bear market rally, we still need more time and data. Now that we’re nearing the end of earnings season (which I think was better than most expected), the only major catalysts for the markets in the near term would be cooler inflation data (CPI, PPI, CPE) as well as data that suggested the labor market was getting weaker — all of this is needed to get that much anticipated “pause” from the FOMC which won’t happen until May at the earliest but June or July is looking more likely now. My best guess is that we get 25 bps at March/May/June meetings and then by the July meeting we’re seeing those YoY inflation numbers under 4% which means the FOMC says they’re at the end of their rate hiking cycle. It’s possible that sparks a rally in the markets or maybe the markets rally into that event and then sell off afterwards. I have no clue. Will be interesting to watch play out.
With the existing macro headwinds and hawkish FOMC I’m not looking to press my position sizes any bigger than 4-5% but I’m willing to take my exposure up to 50-60% with reasonably tight stop losses while focusing on those stocks that had the best reactions to Q4 earnings (and 2023 guidance) and now pulling back to some support areas. The question is how aggressively do I move up my stop losses — the market will help me figure this out.
I shared it yesterday but just in case you missed it here’s my Q4 earnings gap up list: https://docs.google.com/spreadsheets/d/1qLy5c6Rq_MGvOT4LbChyaKT1P29j7uhutYo9XCmKLu8/edit#gid=0
Below the paywall is my current trading portfolio (10 stocks, ~40% invested) and watchlist (19 stocks with charts) including a link to my trading portfolio spreadsheet (with entry prices, position sizes, stop losses & YTD performance). You also get links to my two daily Zoom sessions at 10:30am EST and 3:30pm EST where I review charts for both my portfolios plus my watchlist stocks and explain where & why I started new trading positions or closed out existing ones.


