Trading charts for Thursday, February 16th
Good morning and Happy Thursday,
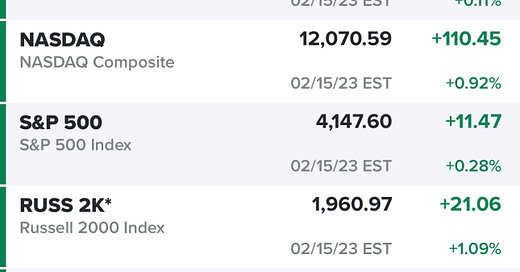
Another week is flying back with more gains in the markets. Yesterday turned into a pretty nice day especially for growth stocks fueled by pre-market earnings from RBLX and TTD. Here’s how the indexes finished:
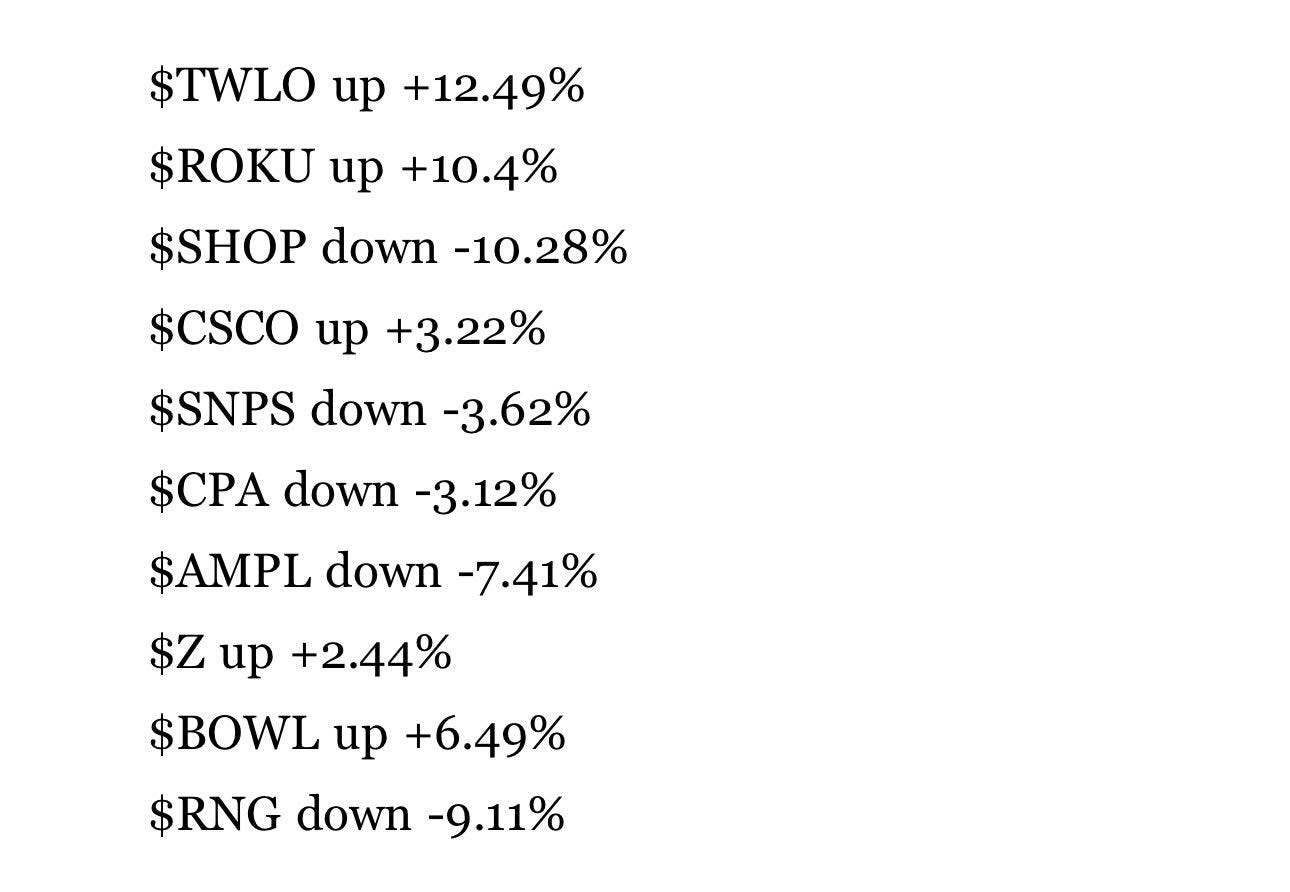
Yesterday after the market close we got another flurry of earnings and here’s how they looked before I went to bed:
This morning we get earnings from DDOG, DOCN, CROX, SHAK, HAS, ZBRA, NRG, IRDM, POOL, PARA and TOST (among other) then after the close we get earnings from SWAV, STEM, DASH, AMAT, RDFN and HUBS [click here for the full calendar].
It’s certainly possible this market continues to rally back to the summer highs which is 4.3% higher from here but I’d be shocked if we went much higher than that. Valuations and multiples are already stretched and if we got back to 4327, assuming $220 of SPX earnings this year, means we’d be trading at 19.6x 2023 earnings which isn’t cheap compared to historical averages especially with short term rates approaching 5% and the Fed doing $95B of quantitative tightening every month.
Below the paywall is my current portfolio (14 stocks) and watchlist (41 stocks) with a link to my trading portfolio spreadsheet (entry prices, position sizes & stop losses). You get charts for all 41 stocks on my watchlist which are the best trading setups and potential breakouts I see coming into today. Yesterday I closed out 7 positions of which 3 were winners and 4 were losers. Average winner was 8.5% while the average loser was 2.7%. I’m also in the green on all 14 remaining positions in my trading portfolio. You also get links to my two daily Zoom sessions at 10:30am EST and 4pm EST where I review charts for both my portfolios plus my watchlist stocks and explain where & why I started new trading positions.


