

Trading charts for Monday, February 27th
Trading charts for Monday, February 27th

Good morning and happy Monday,
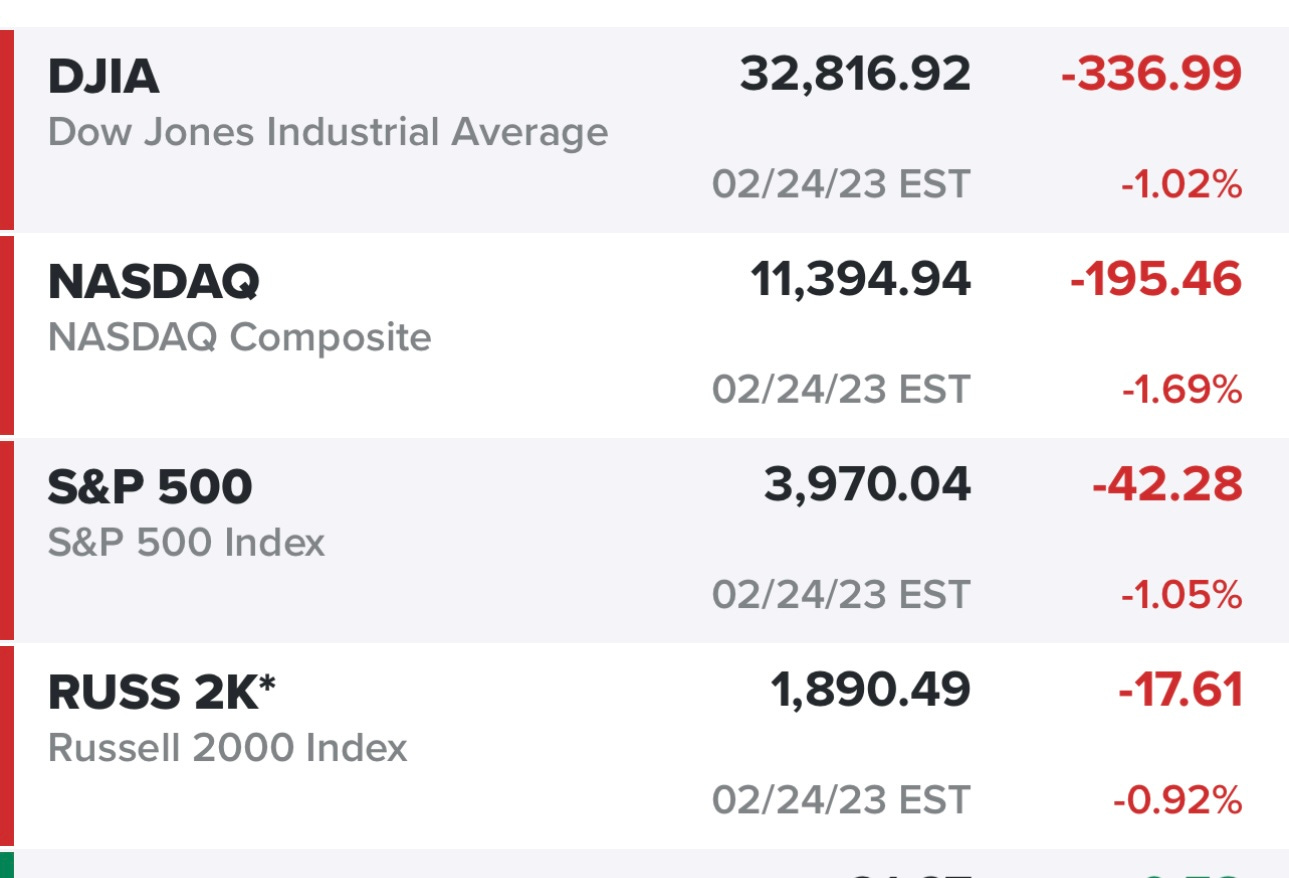
We’re coming off a pretty ugly Friday session, mostly caused by a hotter than expected PCE number and rising yields with the 10Y getting back to 3.95% on Friday.
As of 5:30am EST the equity futures are in the green despite the 10Y yield hitting 3.97% which is going to be a headwind for stocks whether we like it or not. Unfortunately macro is still part of the story and will make it hard for stocks to mount any sort of meaningful rally. Combine that with valuations for SPX (not cheap) and it’s hard to be super bullish in this market which means I’m willing to have some exposure in my trading portfolio and look for attractive risk/reward opportunities but no reason to be fully invested or get aggressive with positions.
As I mentioned on Friday, now that we’re 85% of the way through earnings season I’m focused on the stocks that had big breakouts and gap ups after Q4 earnings but then pulled back 10-15% to their moving averages whether it be the 8/10d ema, 20d sma, 21/23d ema or 50d sma/ema. Every stock/chart is different so you so it’s a case by case situation.
For instance I started a position on Friday in ABNB when it bounced off it’s 20d sma while starting a position in UBER as it bounced off it’s 23d ema. I don’t know if the market will move higher over the next few days/weeks however if it does I’d expect the stocks with the strongest Q4 reports and best post-earnings reactions to be the outperformers in any sort of up market.
With that said, here’s a spreadsheet I started putting together on Friday of the stocks that gapped up on Q4 earnings (although the best reactions are usually a result of strong forward guidance): https://docs.google.com/spreadsheets/d/1qLy5c6Rq_MGvOT4LbChyaKT1P29j7uhutYo9XCmKLu8/edit#gid=0
On Friday I started positions in 7 of the stocks on this list and I’m willing to start several more if the opportunity presents itself however I’m keeping position sizes at 4-5% and I’m still using stop losses below those key support levels.
Below the paywall is my current trading portfolio (8 stocks, ~32% invested) and watchlist (17 stocks with charts) including a link to my trading portfolio spreadsheet (with entry prices, position sizes, stop losses & YTD performance). You also get links to my two daily Zoom sessions at 10:30am EST and 3:30pm EST where I review charts for both my portfolios plus my watchlist stocks and explain where & why I started new trading positions or closed out existing ones.