Trading the Charts for Monday, October 9th
In order to read this entire newsletter you’ll need to become a paid subscriber by clicking the button below. Paid subscribers get full access to my trading portfolio (up +69% YTD), watchlists with charts, daily activity (buys & sells plus entry prices & stop losses, performance, etc) and my daily webcasts.
I also run a Stocktwits rooms where I post throughout the day about my investment portfolio (up +95% YTD) with full access to my holdings, performance, daily activity, market commentary, quarterly earnings analysis, daily webcasts and more.
Here are my deep dive newsletters…
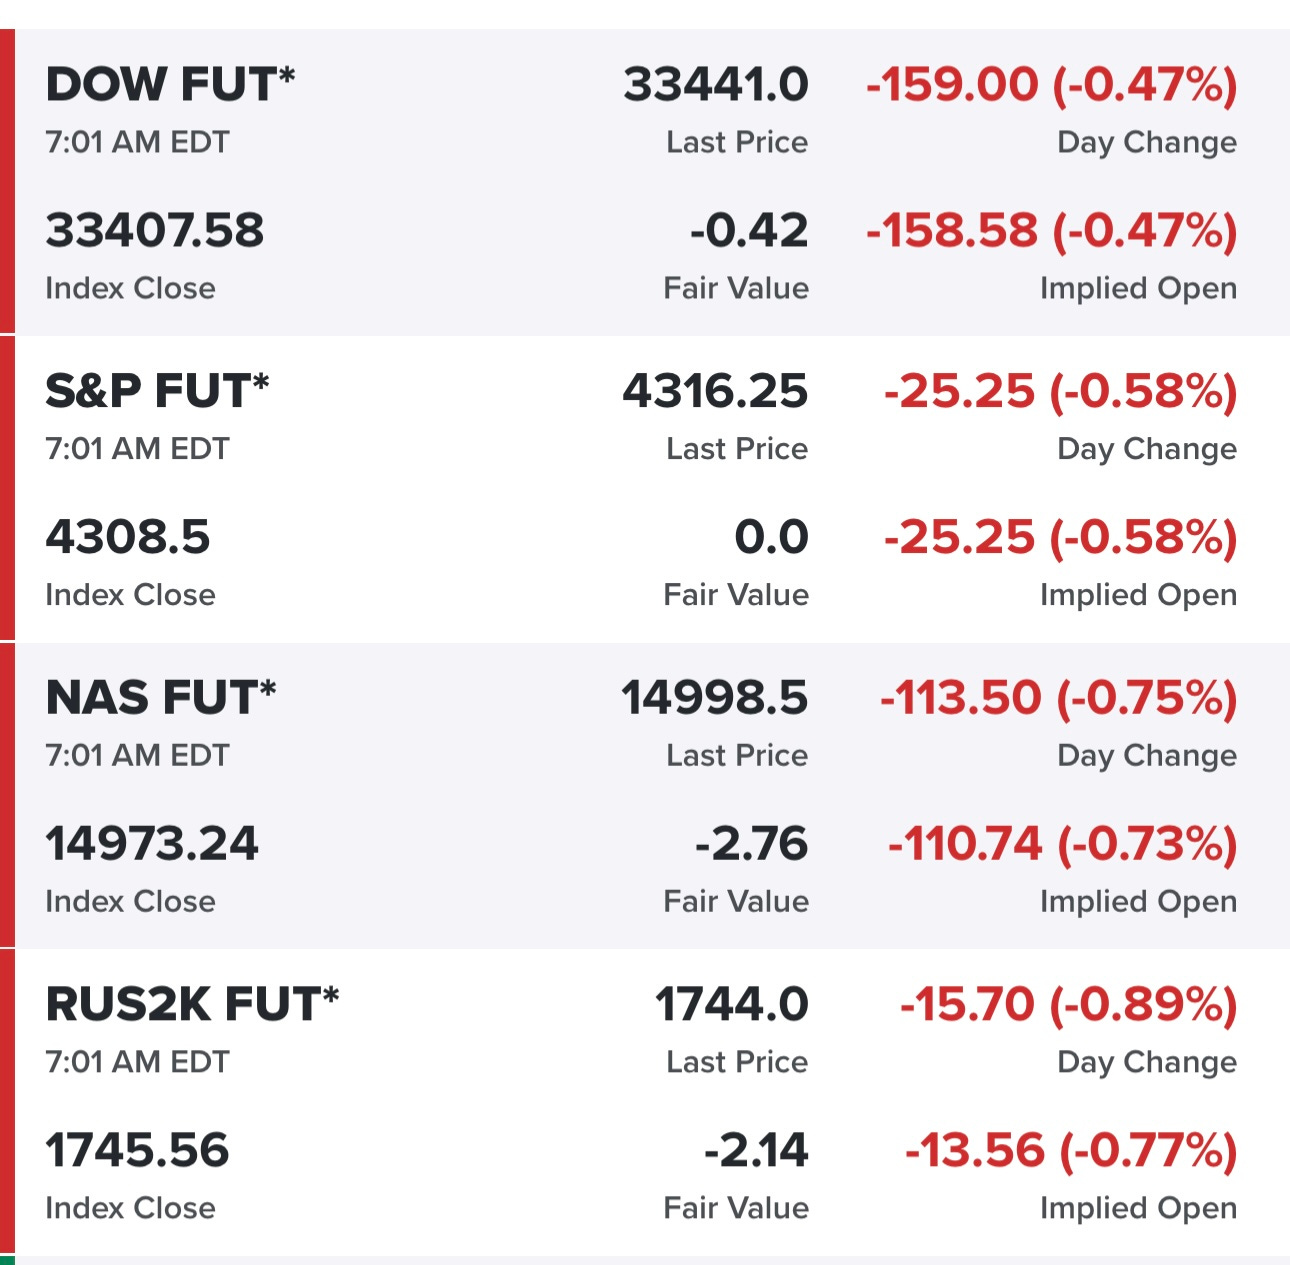
Equity futures not looking good, obviously the events from Israel over the weekend are playing a role…
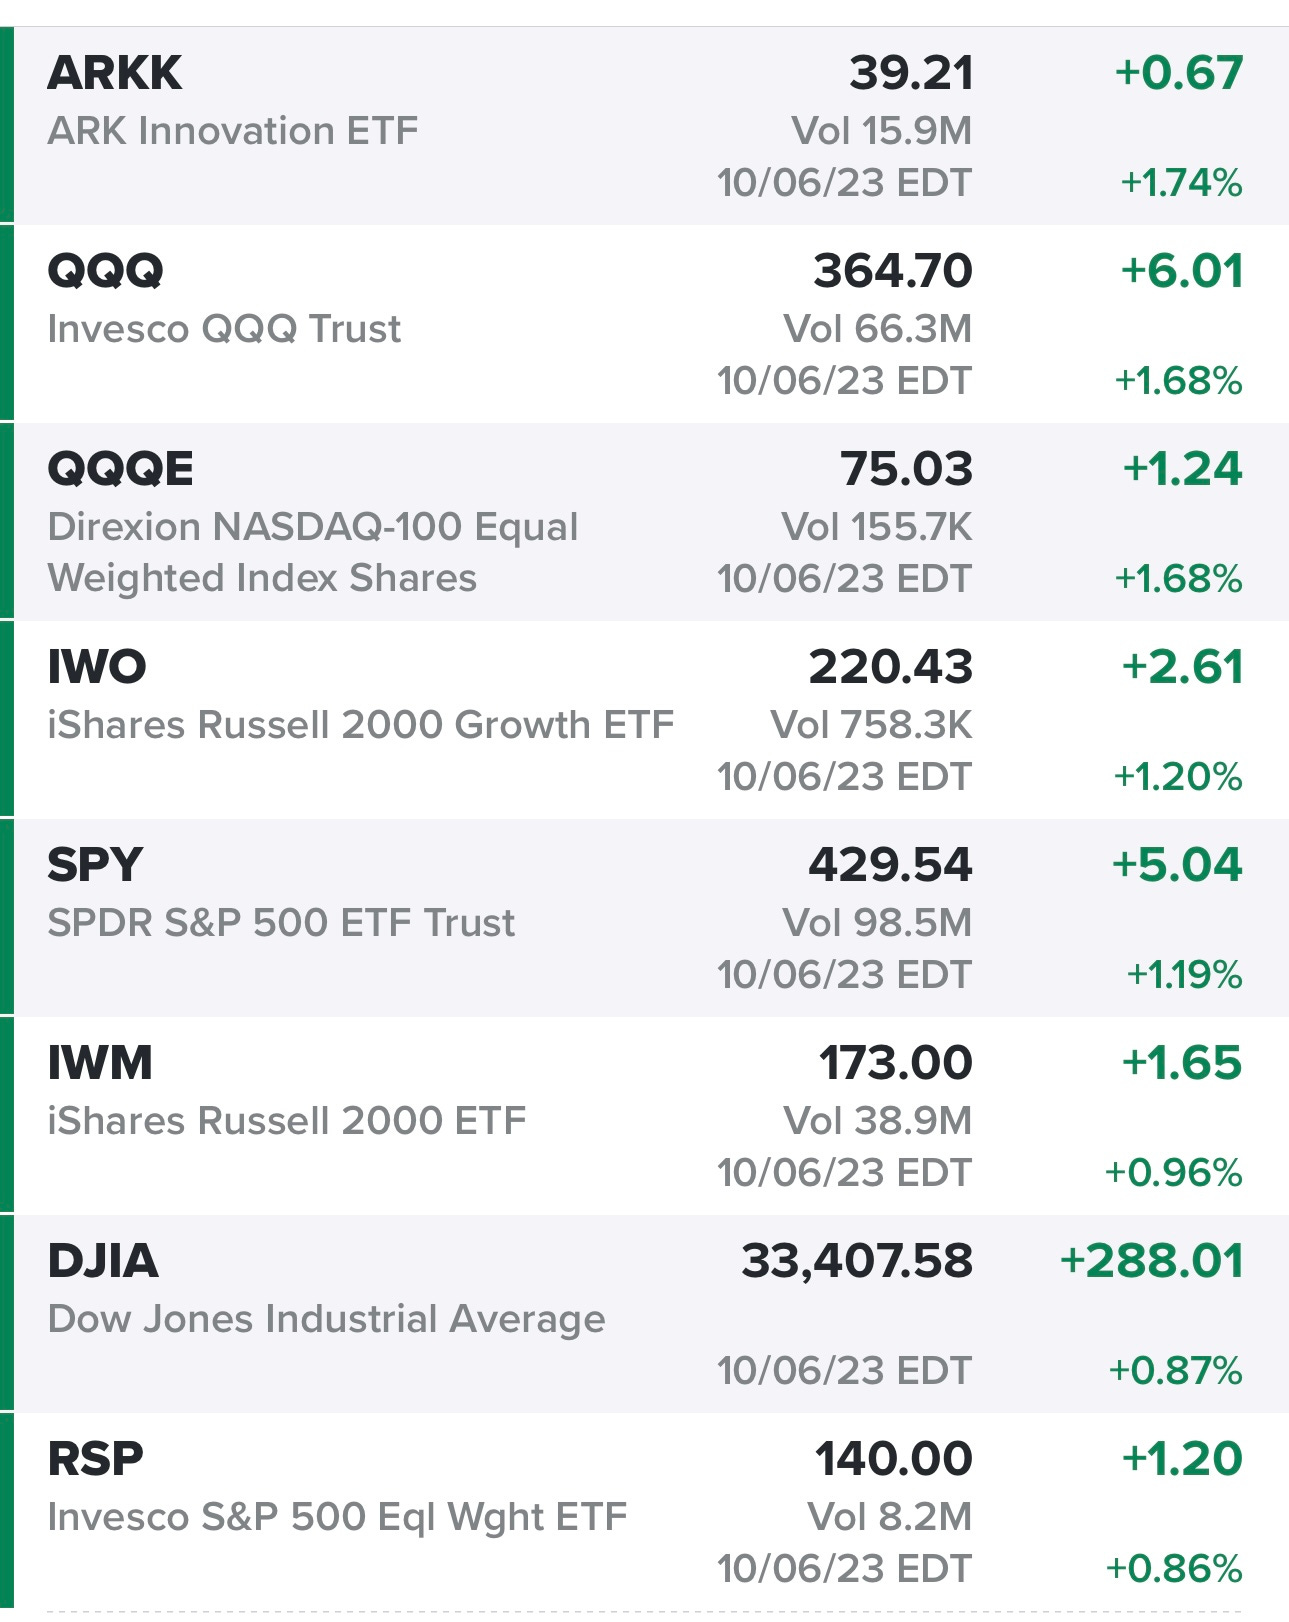
Markets finished in the green on Friday after being down in the morning on the hotter than expected jobs report, it’s possible we saw the near term bottom on Friday…
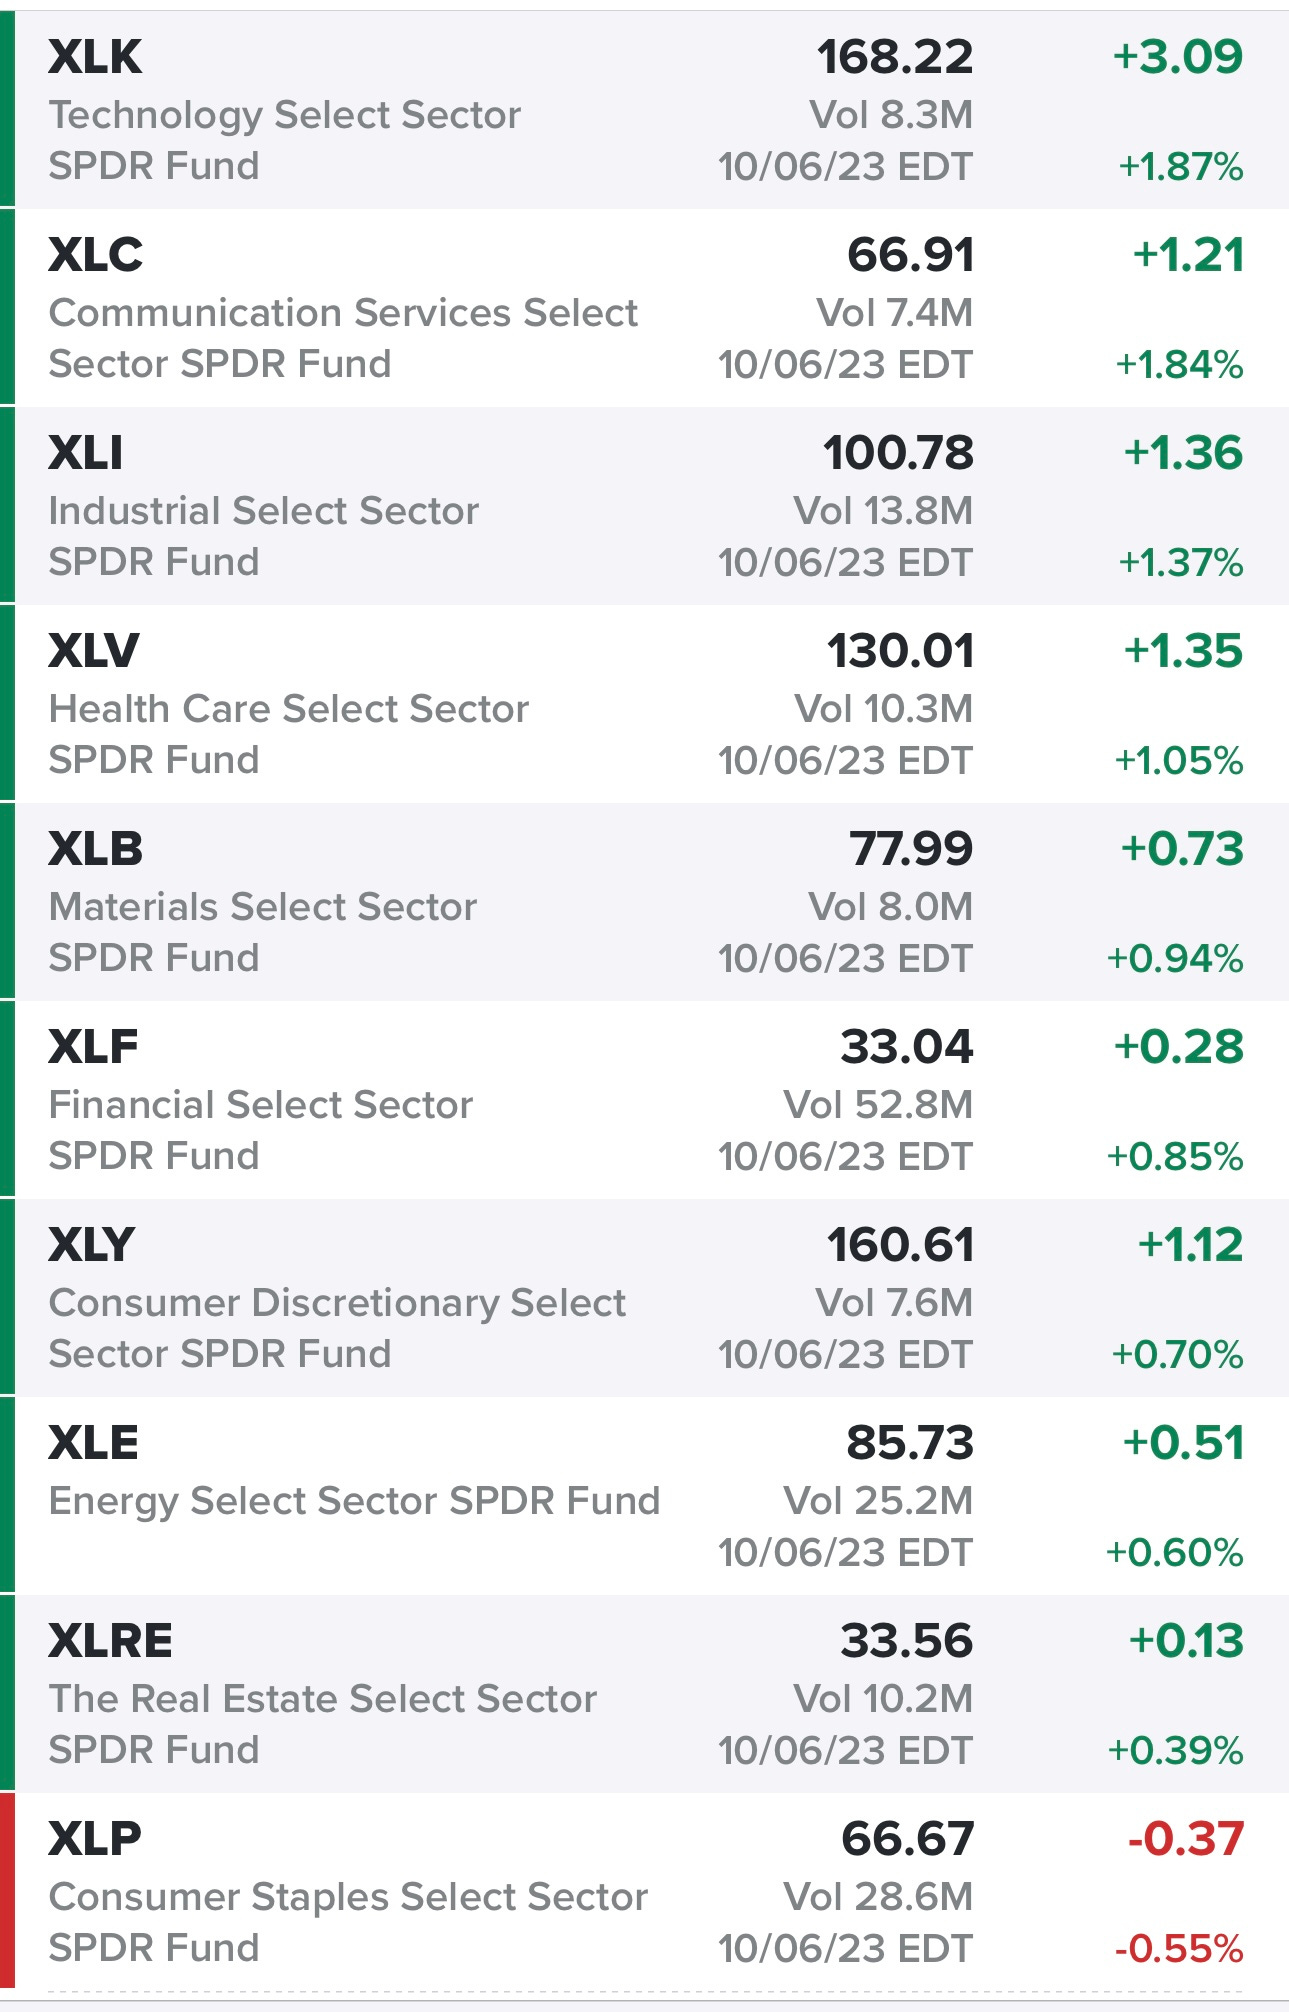
This is how the sectors did on Friday…
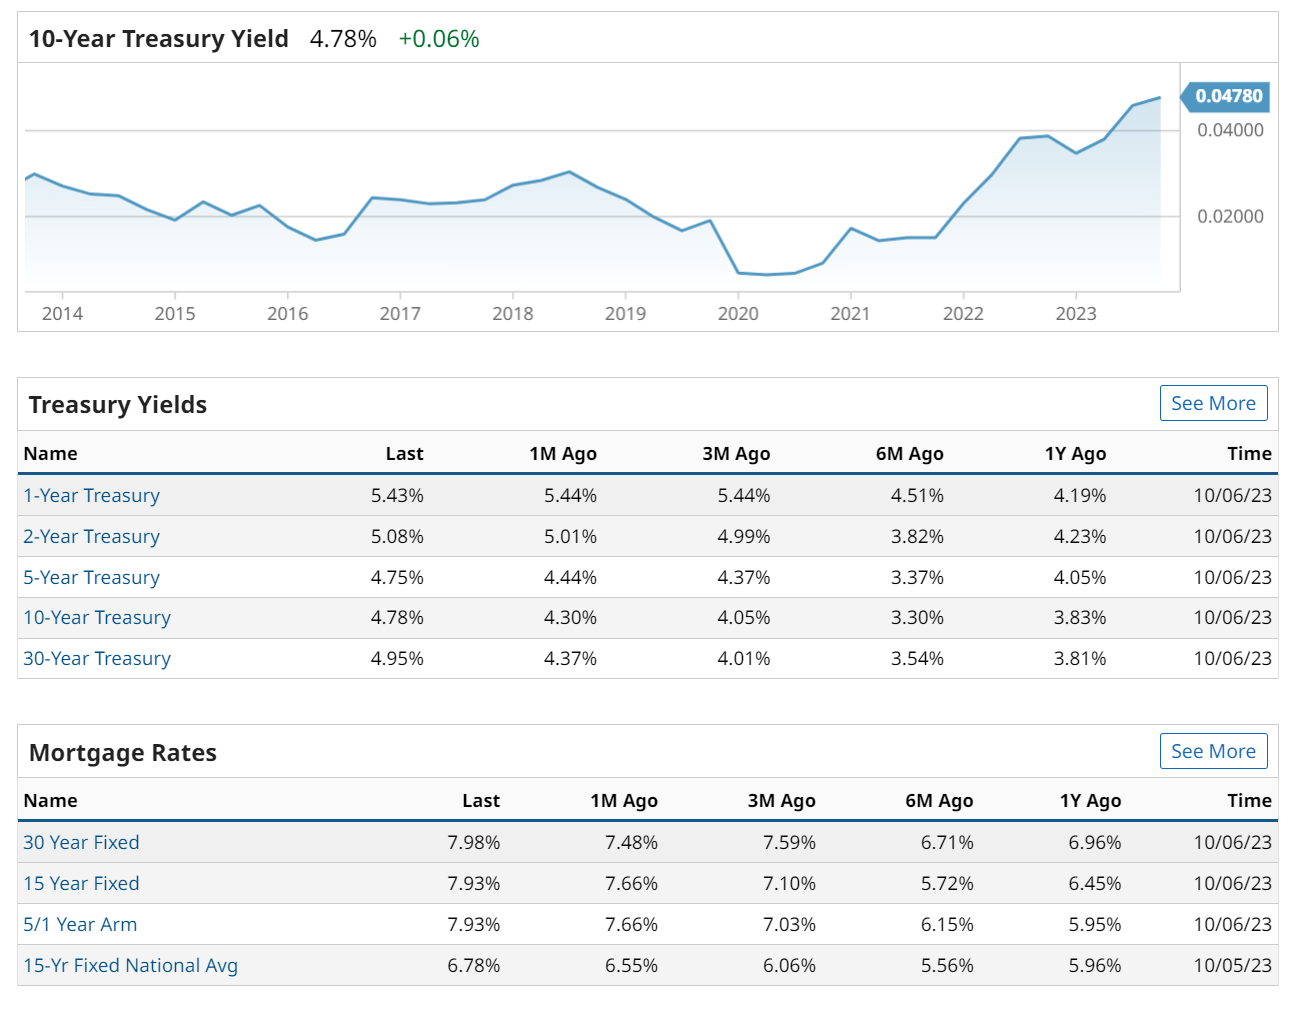
10Y sitting at 4.78% with the bond market closed today…
New highs vs New lows…
Market momentum — 17% of the S&P now above their 50d moving average, last week I believe this number got down to 11% historically is when things start to look very oversold.
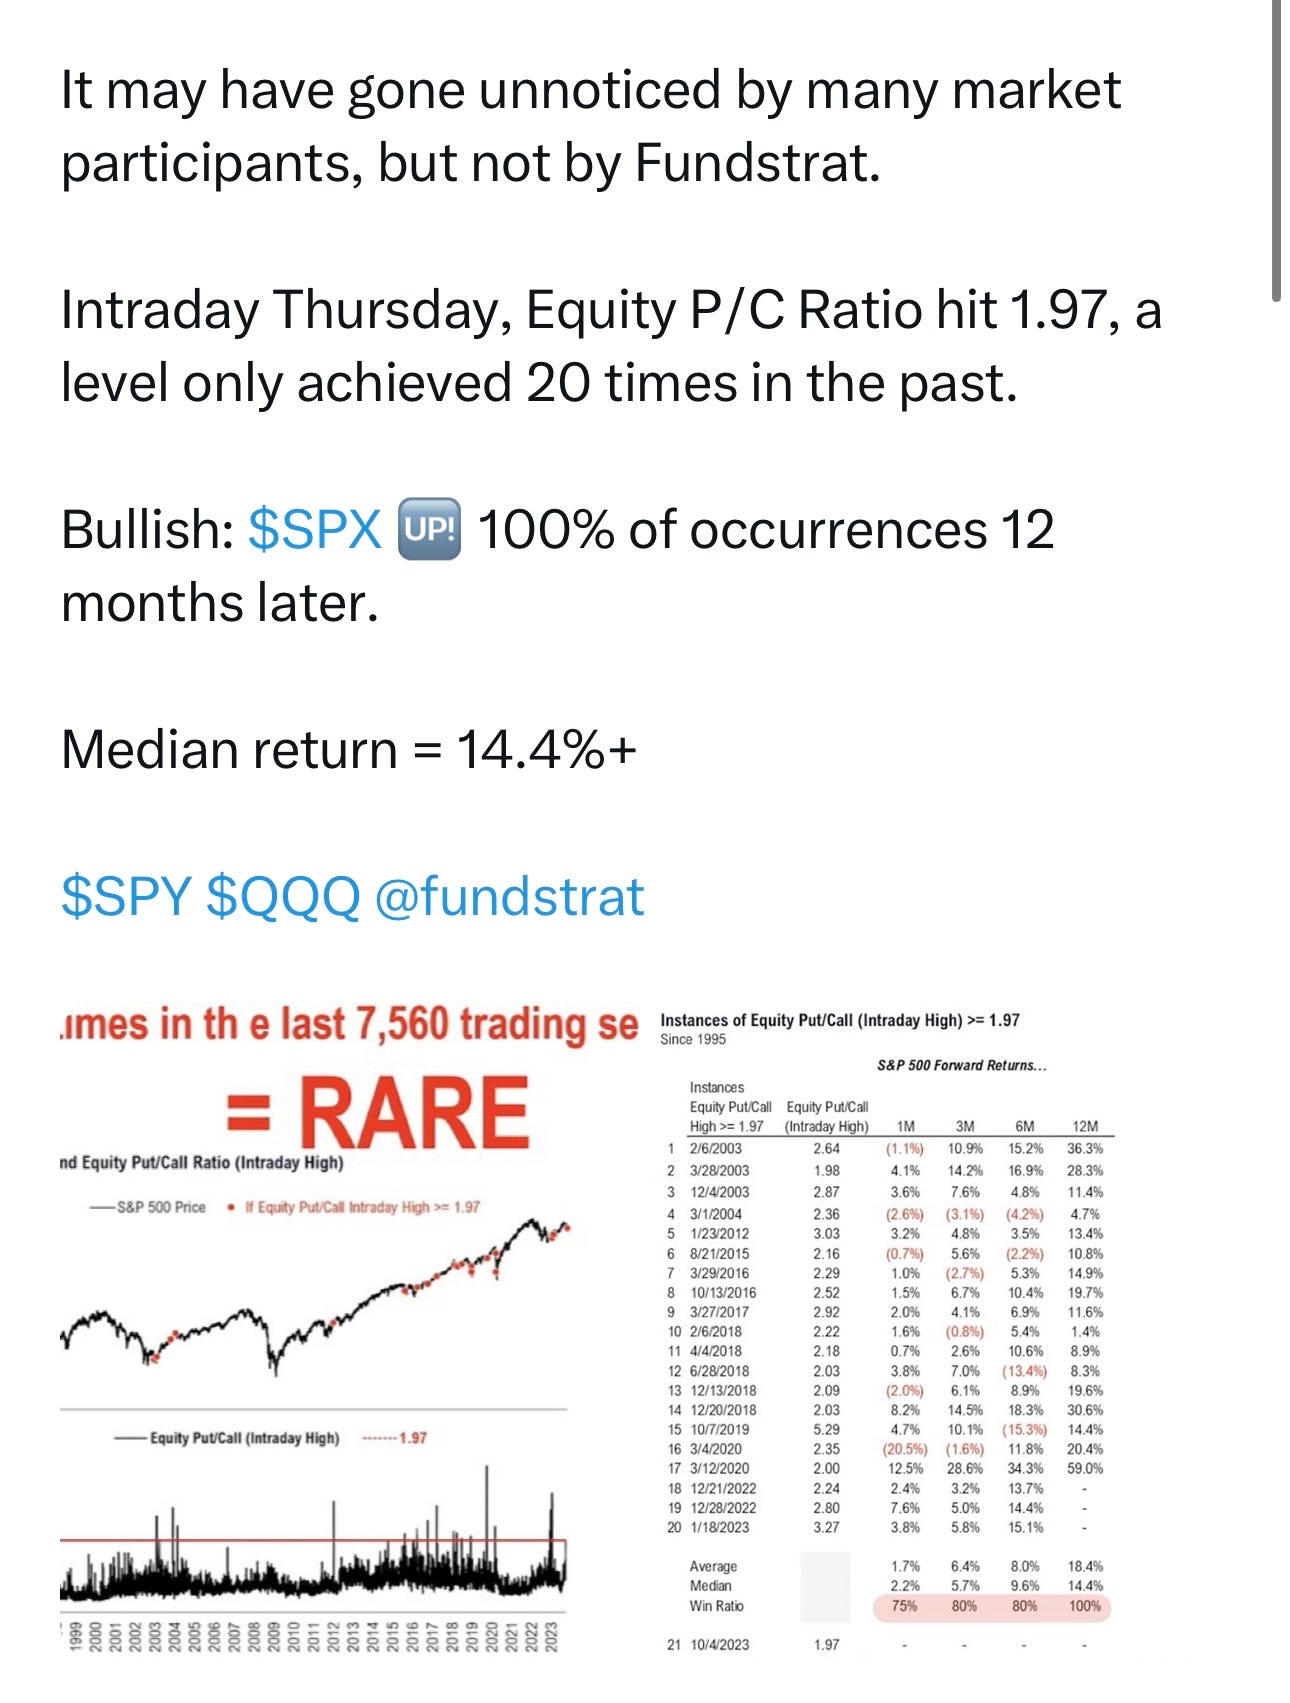
Put/Call ratio last week marked “peak bearishness” often found at bottoms, the same thing happened at the lows in late 2022
$TNX — bond market is closed today so we won’t see yields moving
$VIX — still above the 200d
$CL1! — oil is up ~3% this morning because of the geopolitical conflict in Israel/Gaza
$SPX — bouncing off the uptrend line from October lows, just above the 200d sma
$SPX still bouncing off the uptrend line from March 2020 lows
SPY
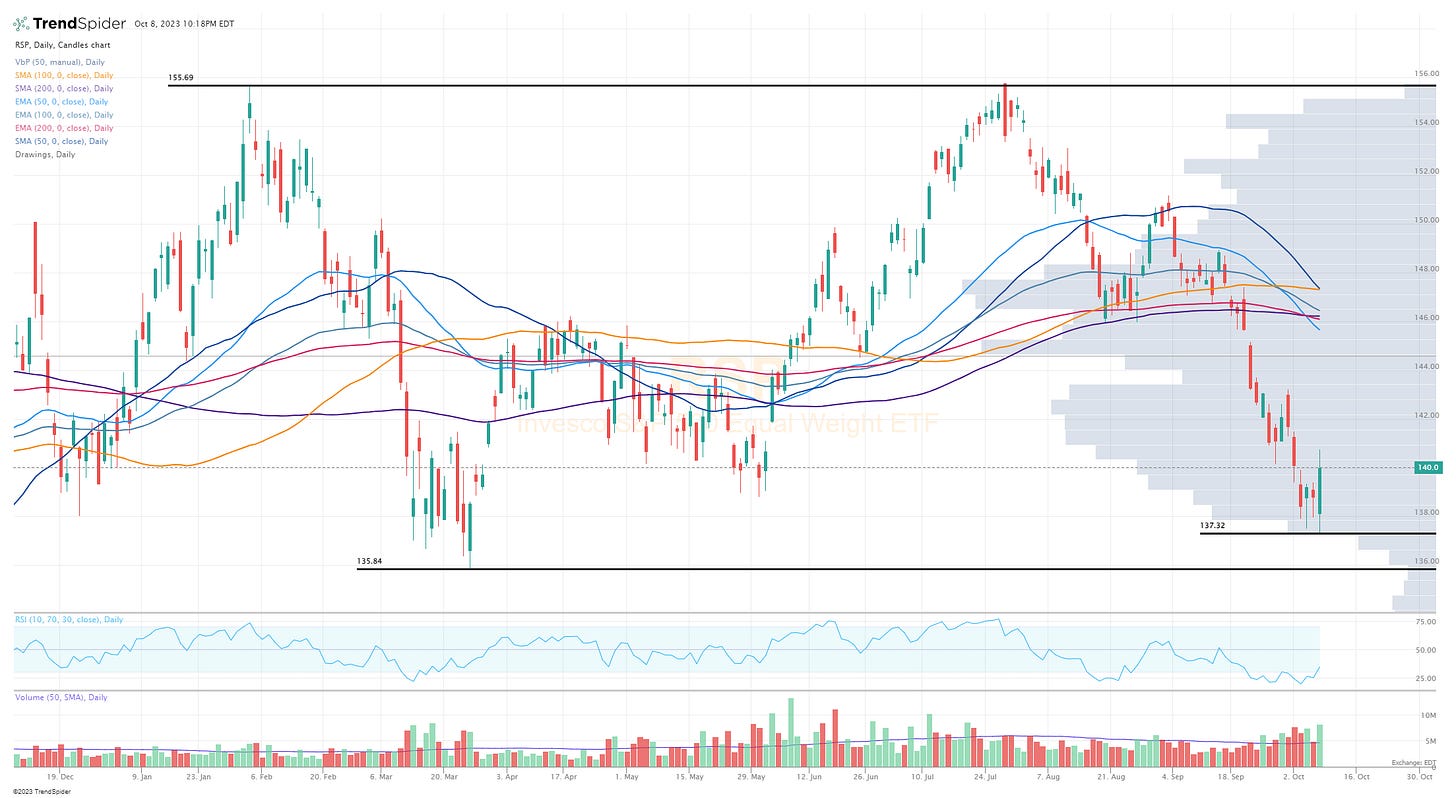
RSP
QQQ
QQQE
IWM
IWO
ARKK
Deepvue screen #1: AFL ALSN ANET APO APP ARMK AVY AYI BAH BBDC BILL BRBR BRZE CCCS CHS CI CNK COR CRBG CRWD CSGP CWAN DBX DT DUOL EDU ESMT ESTC FERG FLR HDSN HUM INVA J LRN MOD MRTX MSFT MU NARI NBIX NU NVDA NVS OHI PANW PAYO PCAR PCOR PGR PLTR QTRX RBA RELY S SAN SNOW SNPS SPOT STLA STLD TENB UNH UNM VRRM VRTX WVE X XPO ZS
Criteria: market cap above $500M, above 20d sma, above 50d sma, above 200d sma, average volume above 300k, sales acceleration last 2 quarters
Finviz screen #1: ACGL ACMR ANET ARES AXNX BAH BILL BRBR CDNS CEIX CLS COR CPRT CSGP DHT DKNG DT ESTC EXEL FRO GLBE HUM INSW IONS LAUR LLY LPG LYV MANH MCK META MOD NTNX NVDA PANW PAYO PCAR PCOR PRDO PWSC REGN RELY S SKWD SMCI SNPS SRPT TENB TH TNGX TSLA TT VEEV VRT VRTX WRB WRBY YMM ZS
Criteria: price above $5, market cap above $1B, above 20d sma, above 50d sma, above 200d sma, average volume above 400k, QoQ earnings growth above 10%, QoQ sales growth above 10%
Finviz screen #2: ACGL ACMR ADSK AJG AM AMGN ANET ANF APO ARES AVPT AXNX BAH BGC BILL BRBR BRC BRZE BSY BWXT CAH CCCS CDAY CDNS CEIX CI CLS CME CNK COR CPRT CRH CRWD CSGP CTRE CWAN DBX DHT DKNG DT DUOL EDU ESMT ESTC EURN EXEL FLR FRO GLBE GOOG GOOGL GRMN GWRE HQY HUM HZNP IMAX INSW INTU IONS IT J LLY LPG LRN LYV MANH MCK META MMYT MOD MRTX MSFT MSM NARI NBIX NTNX NU NVDA NXGN OWL PANW PAYO PCAR PCOR PDD PGR PINS PLTR PRDO PWSC PYCR RBA REGN RELX RELY RPD S SBRA SFL SFM SKWD SMCI SNOW SNPS SPOT SRPT TENB TH TNGX TSLA TT TTD UEC UNH VEEV VRRM VRT VRTX WMG WRB WRBY YMM ZS
Criteria: price above $5, market cap above $1B, above 20d sma, above 50d sma, above 200d sma, average volume above 500k, QoQ sales growth above 5%
Below the paywall is my current trading portfolio including all positions (open & closed), watchlists, charts, entry prices, stop losses, YTD performance and my daily webcasts.


