


Trading the Charts for Wednesday, October 4th

In order to read this entire newsletter you’ll need to become a paid subscriber by clicking the button below. Paid subscribers get full access to my trading portfolio (up +67% YTD), watchlists with charts, daily activity (buys & sells plus entry prices & stop losses, performance, etc) and my daily webcasts.
I also run a Stocktwits rooms where I post throughout the day about my investment portfolio (up +93% YTD) with full access to my holdings, performance, daily activity, market commentary, quarterly earnings analysis, daily webcasts and more.
Here are my deep dive newsletters…

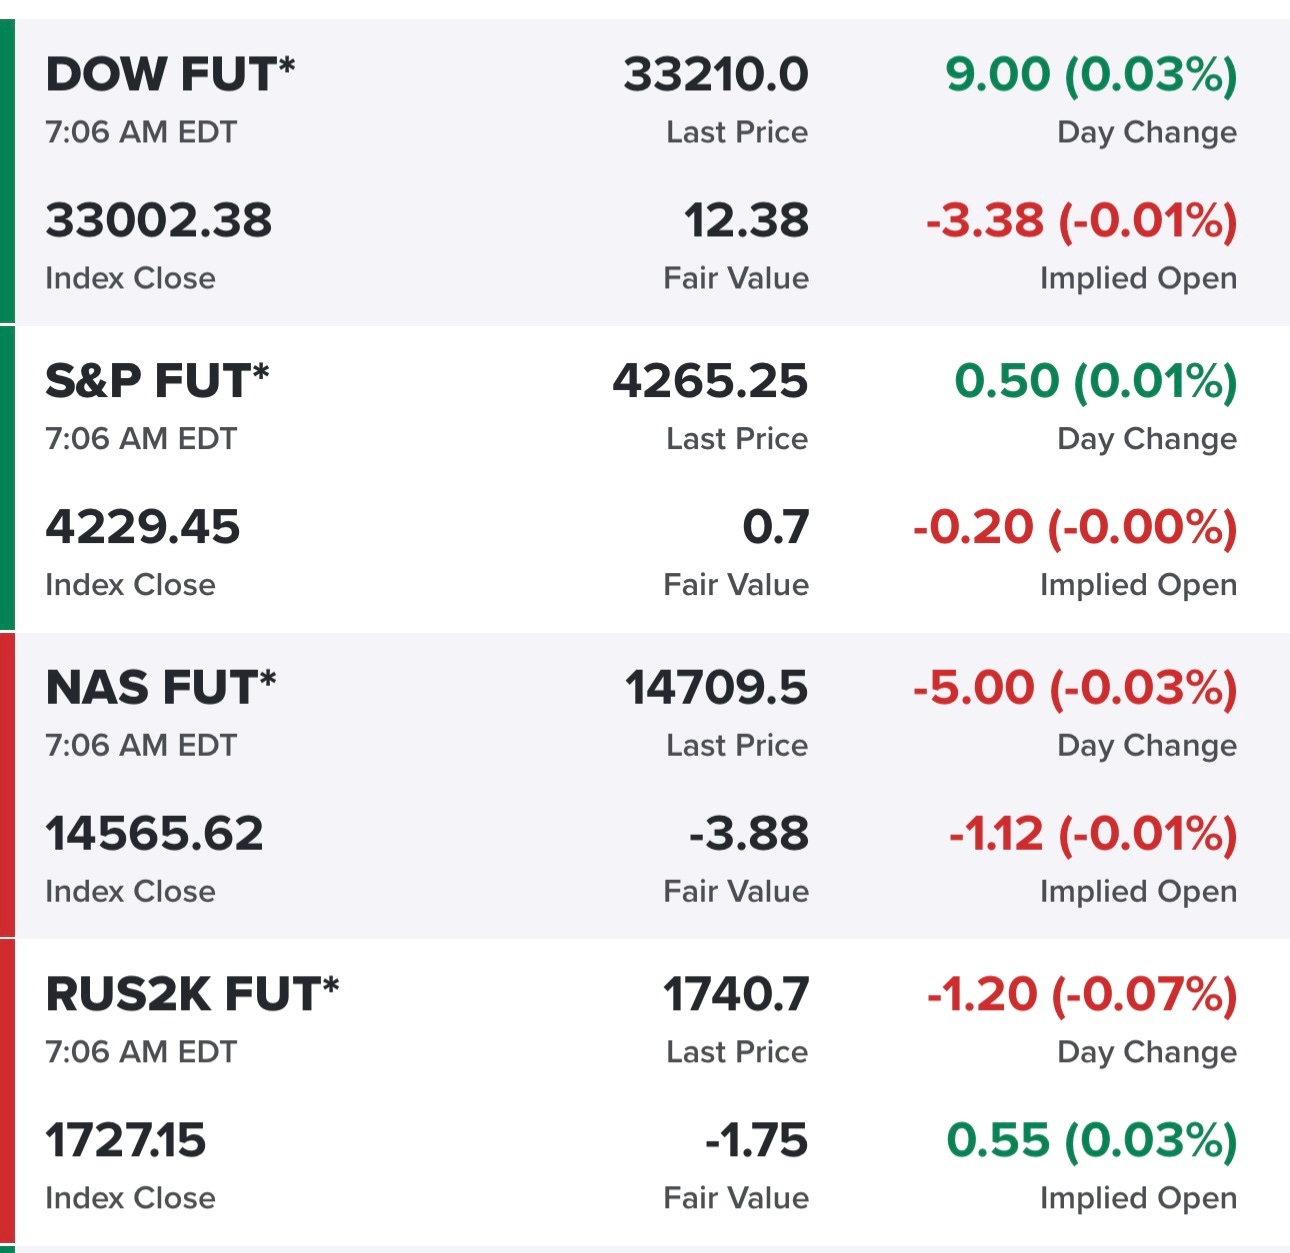
Equity futures are slightly up…
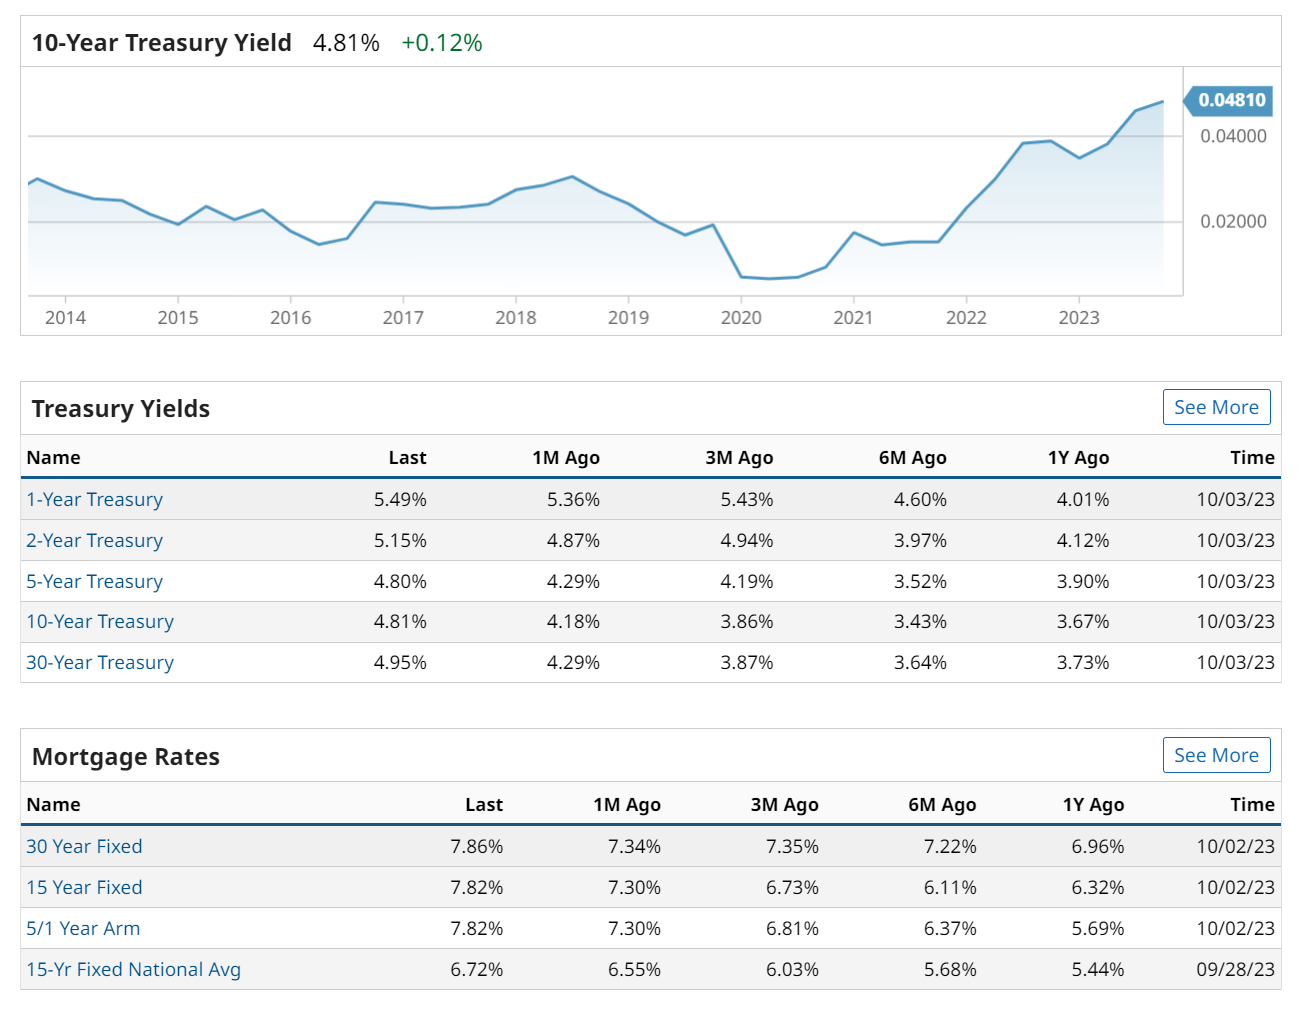
Yields are slightly down but still up huge over the past month..
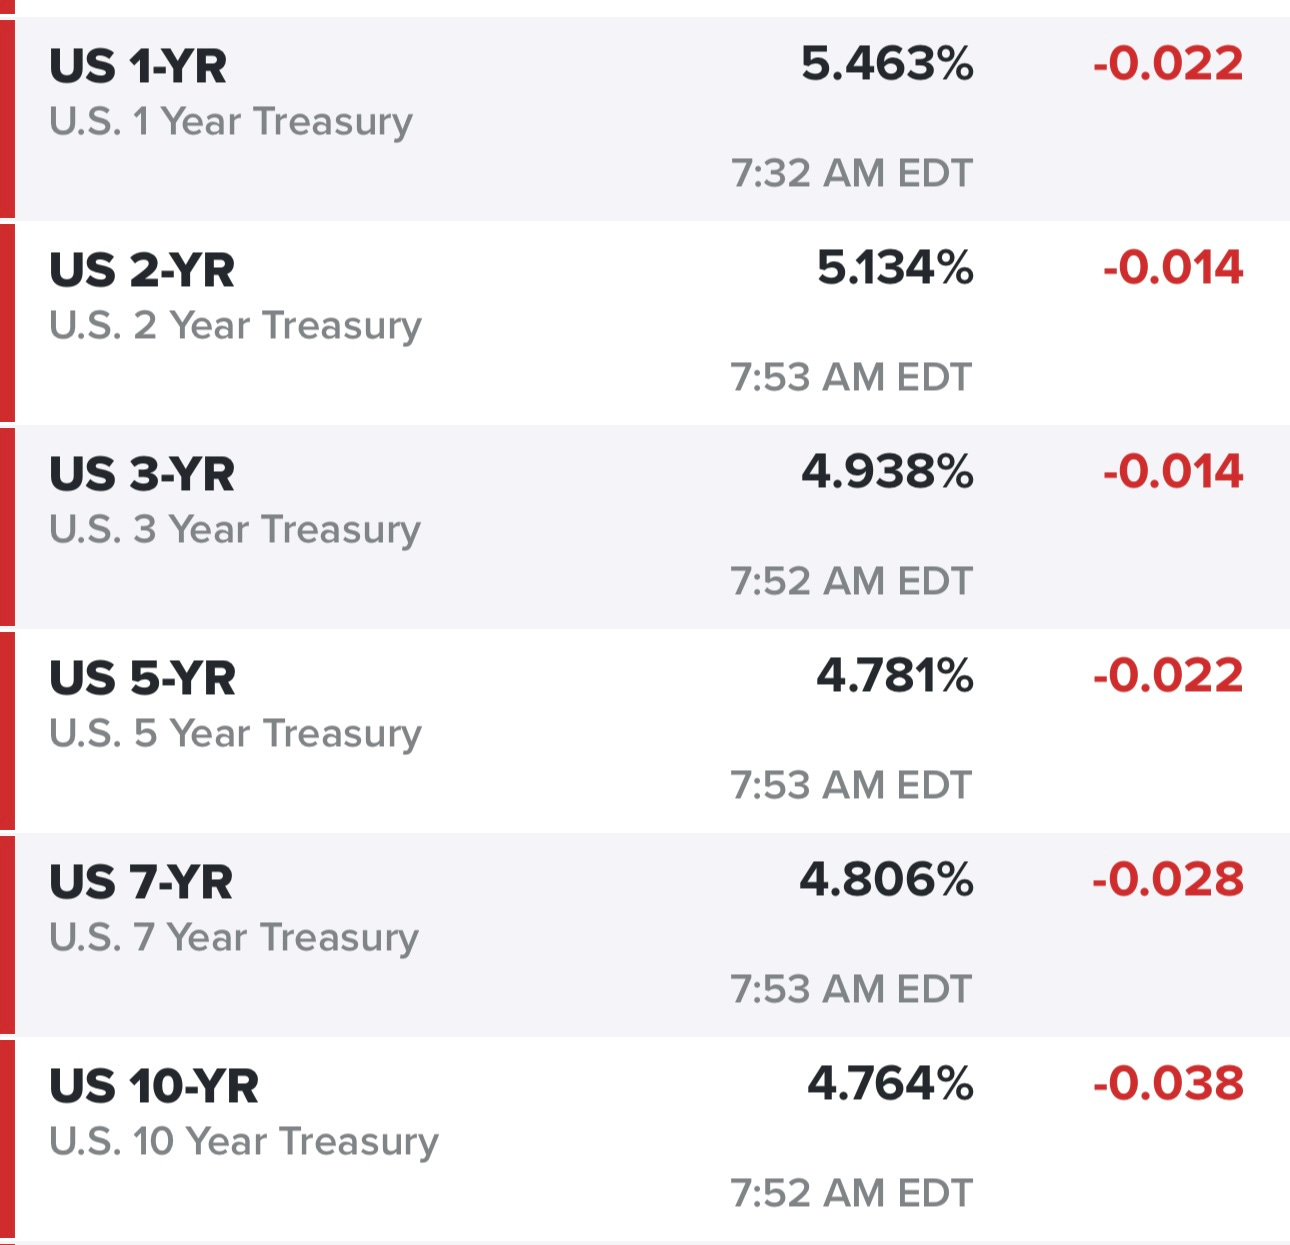
Entire rates/yields picture is getting a little scary for equities (and real estate)…
New highs vs new lows…

Trends & momentum..
$TNX — 10Y yield hit 4.85% last night, it’s pulling back now but I’ve been saying for the past couple weeks that stocks can’t go up if $TNX is going up.

$VIX — still above the 200d sma, need to see the $VIX pull back before stocks can rally

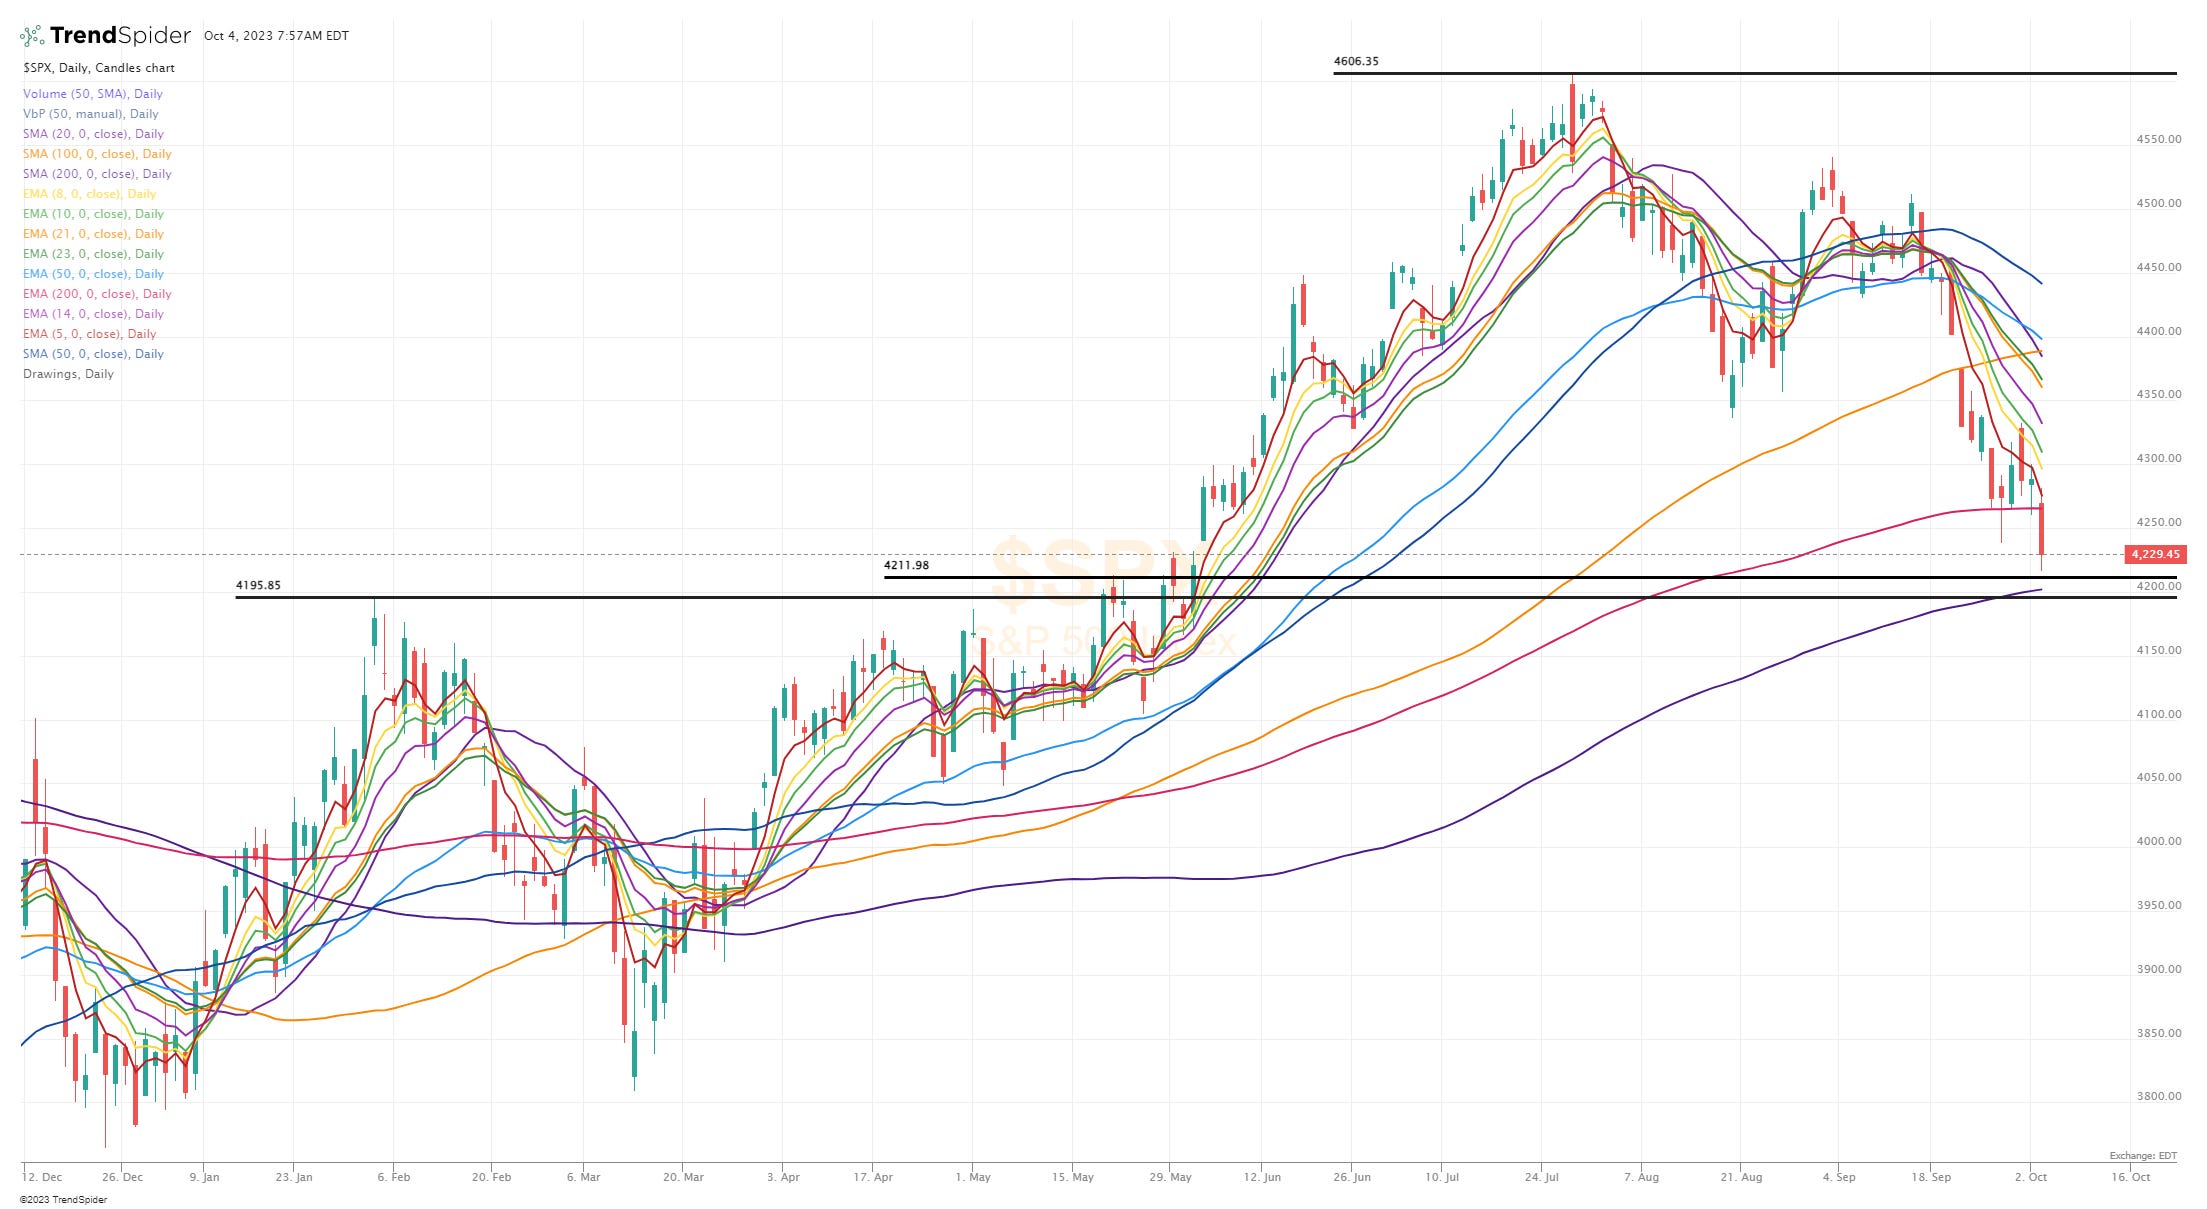
$SPX — I was hoping $SPX would be down today so we could just test 4200 and the 200d sma but not sure that will happen, still feels like it needs to happen before end of week
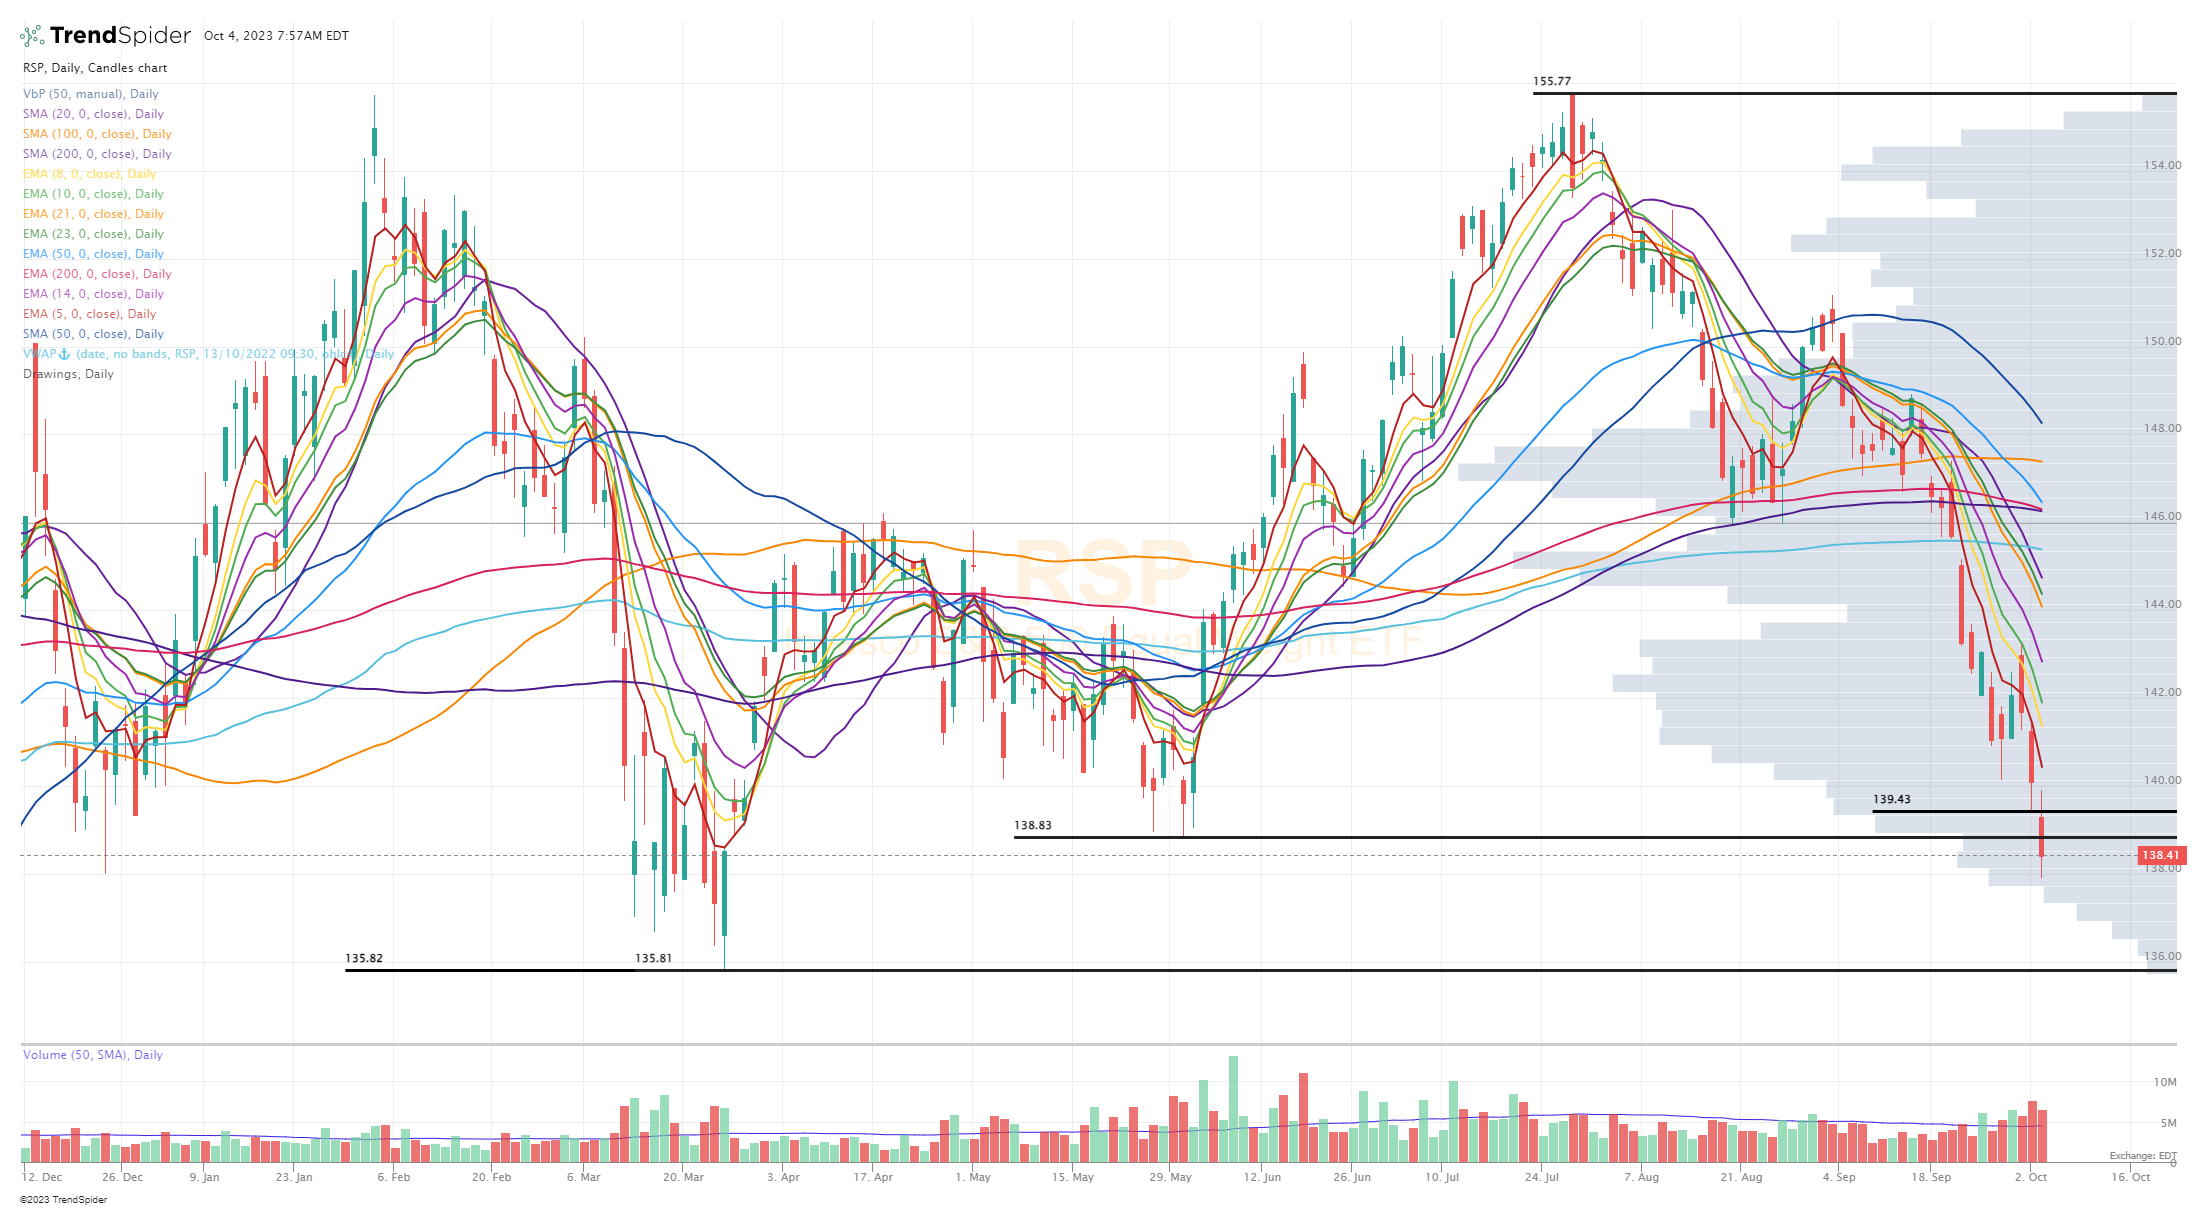
RSP — looks horrible but RSI under 20 so definitely oversold, now -11% below summer high
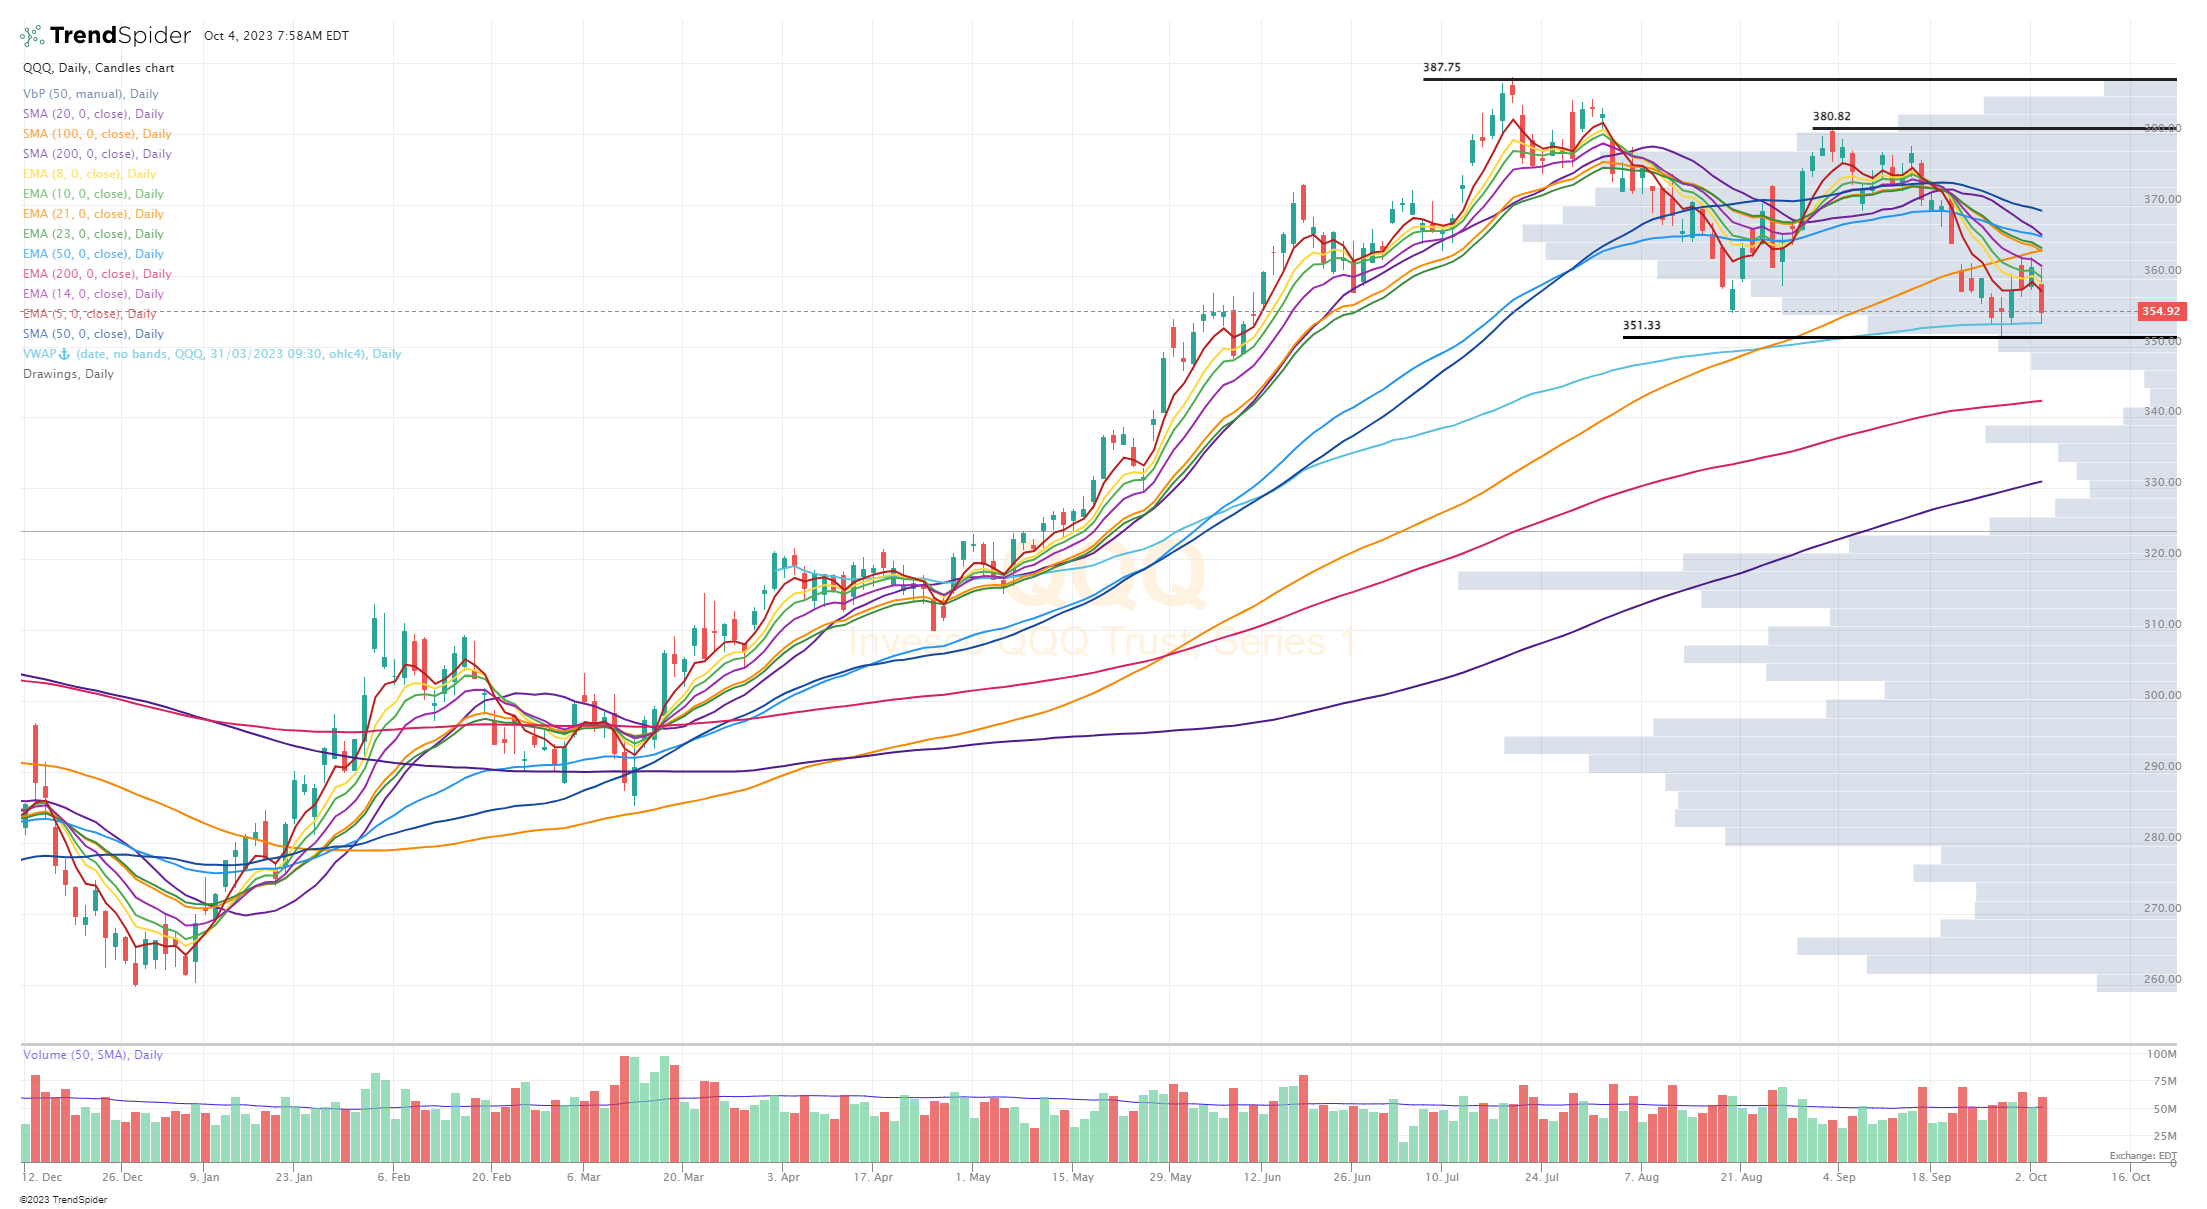
QQQ — holding up better than the other indexes, now -8.5% below the summer highs
QQQE — down -9.5% from summer highs, RSI below 30

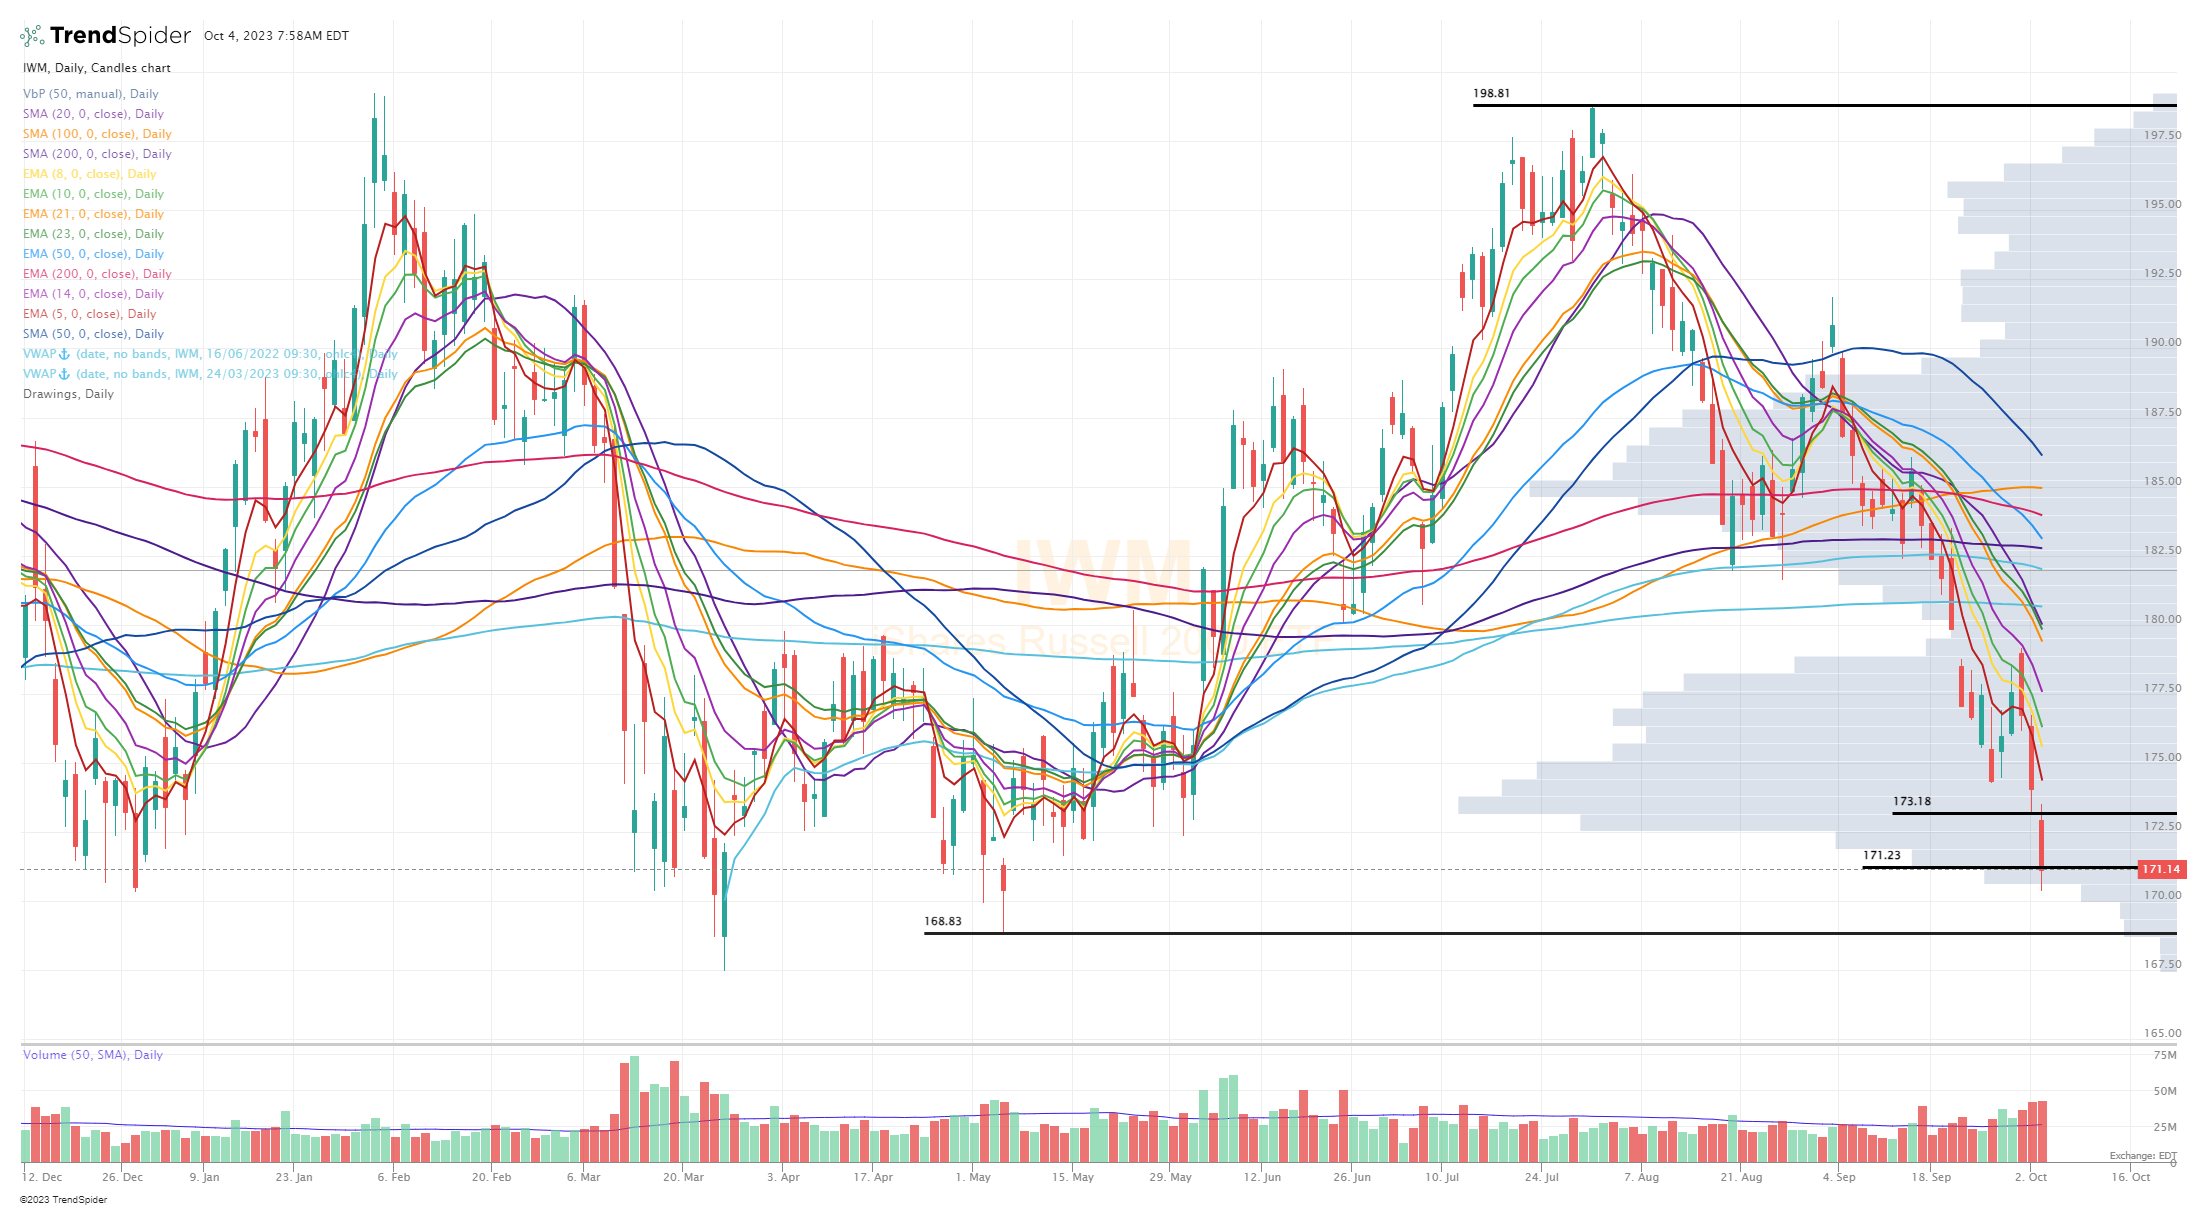
IWM — down -13.9% from summer high, RSI below 25
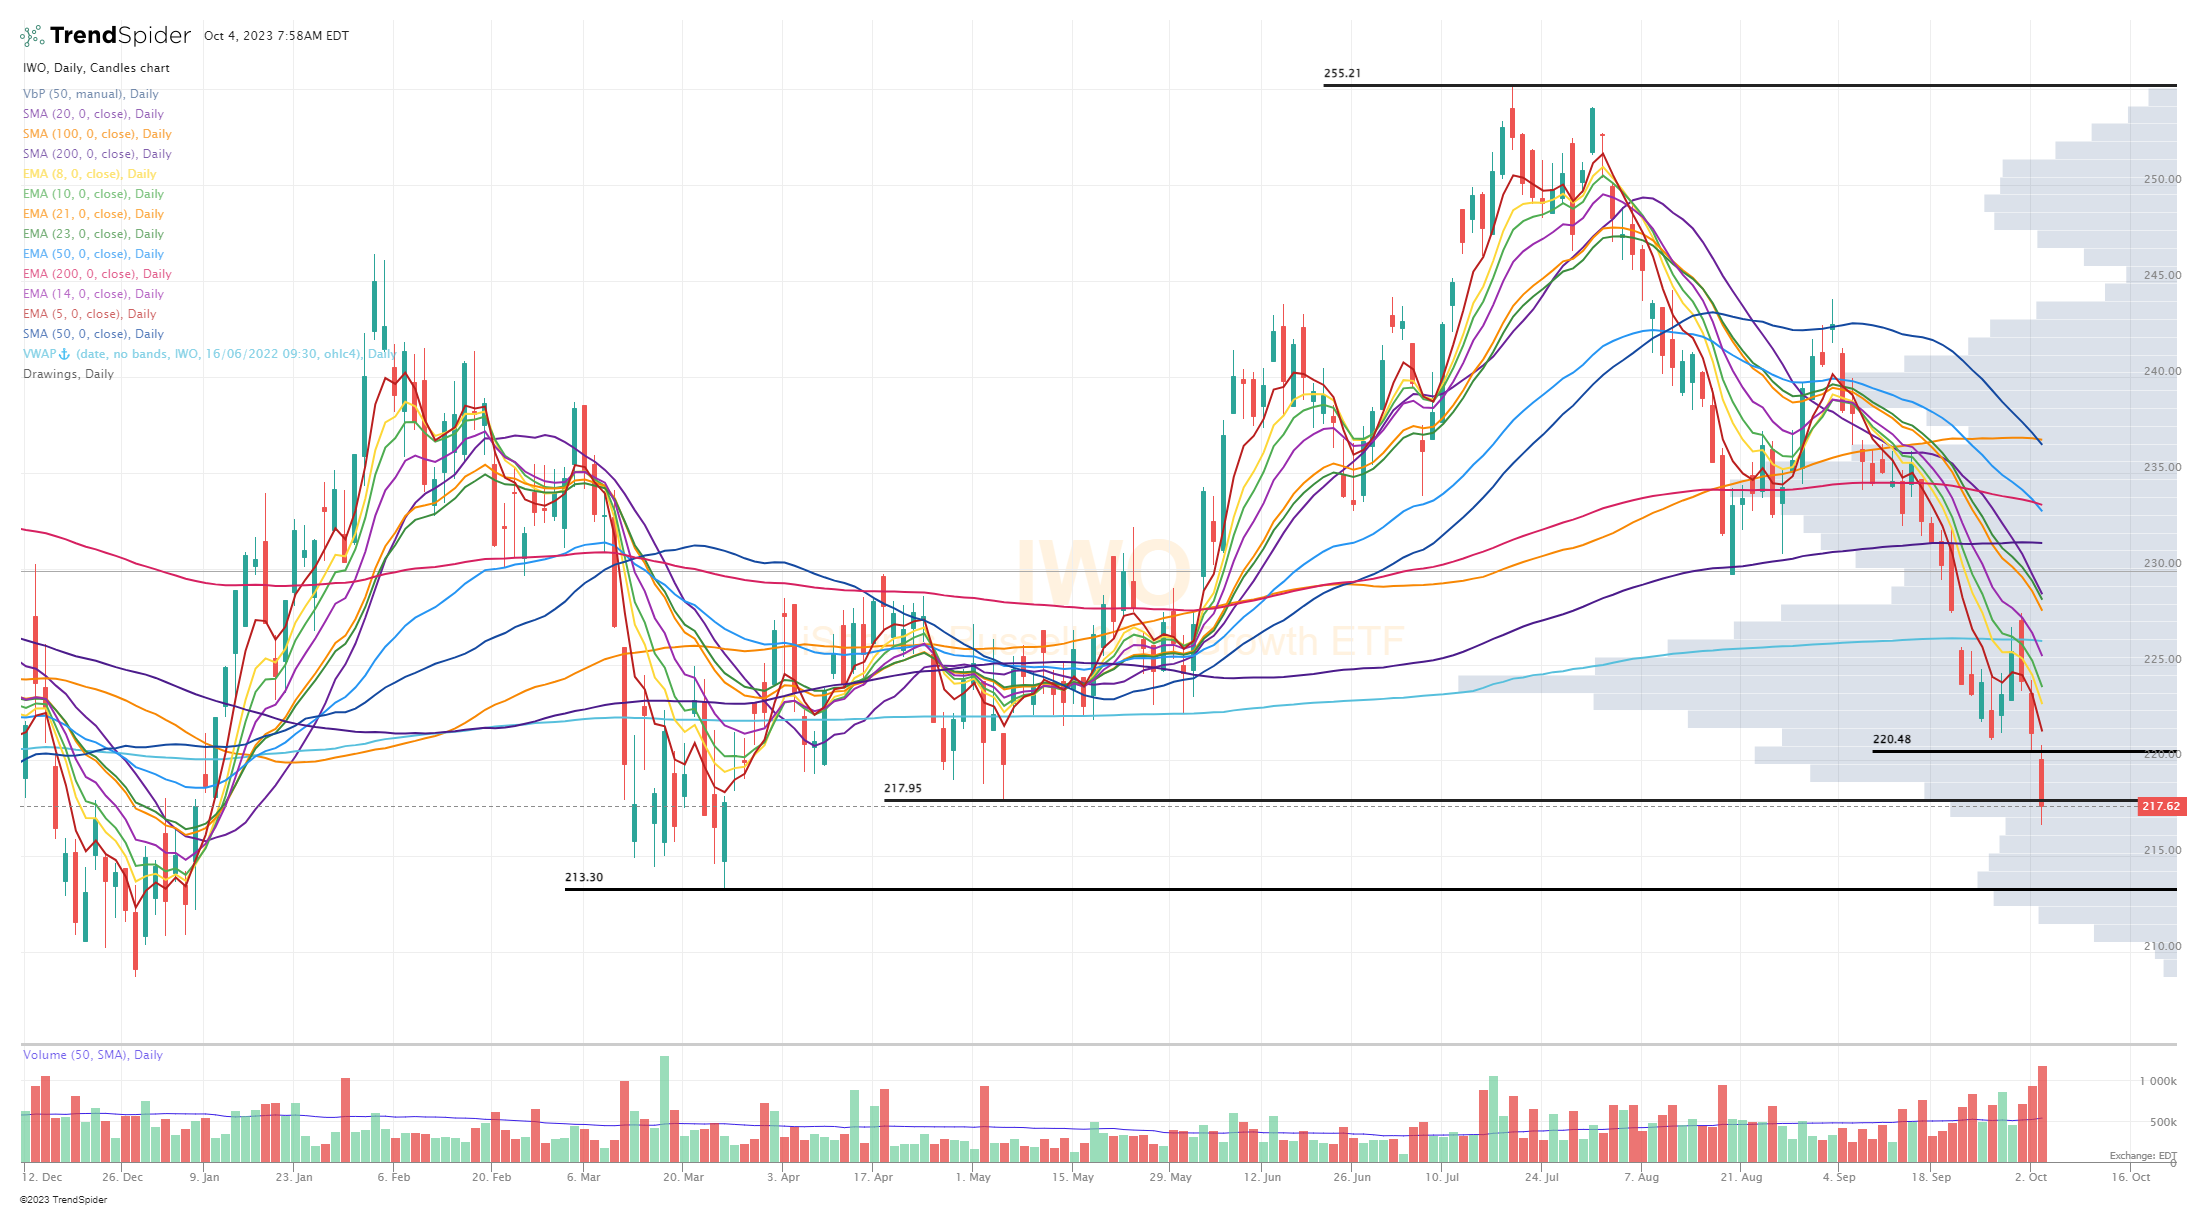
IWO — down -14.7% from summer high, RSI at 25
ARKK — down -26% from summer high, RSI at 27

Deepvue screen #1: ARMK BRBR CCCS CHS CRBG DFIN DUOL ESMT ESTC FDS FERG HDSN J LNTH LRN MRTX NVS PETQ QTRX UNH USAC VERX WVE X XPO
Criteria: market cap above $500M, above 20d sma, above 50d sma, above 200d sma, average volume above 200k, sales acceleration last two quarters
Deepvue screen #2: ACHR ACI ACMR AEHR AMAM APLD ARDX BTE BX CELH CIVI COOP CRDO CVE DBRG DLO DUOL EH GLBE GLNG GTLS IMGN IMTX IONQ JEF JXN KNSA LAC LEGN LI MIRM MMYT MRTX MTDR MU NN NVDA PAA PARR PDD PR RBA RIG RIVN RMBS ROIV S SBOW SDRL SMCI STLA SYM TALO TDW TRGP UPST VET WHD WVE XP XPEV
Criteria: price above $3, market cap above $500M, average volume above 300k, above 200d sma, expected sales growth next 2 quarters above 30%
Finviz screen #1: BRBR CEIX CLS DHT ESTC EXEL FRO FSR GBDC ICPT INSW IONS KTOS LNTH MCK META PRDO SKWD TH TNGX WING WRBY
Criteria: price above $5, market cap above $1B, above 20d sma, above 50d sma, above 200d sma, average volume above 400k, QoQ earnings growth above 10%, QoQ sales growth above 10%
Finviz screen #2: ANF BRBR CEIX CLS DHT DUOL ESMT ESTC EXEL FRO FSR GBDC HQY IMAX INSW IONS KTOS LNTH MCK MMYT MRTX OWL PRDO SKWD SWX TDW TH TNGX UNH WING WRBY
Criteria: price above $5, market cap above $1B, above 20d sma, above 50d sma, average volume above 400k, QoQ sales growth above 10%
Finviz screen #3: ARLP BRBR CEIX CLS COST CXW DHT ESTC EXEL FRO FSR HUM INSW IONS KTOS LNTH LRN MCK MRTX NATI PRDO RELX SBRA SFM SKWD SRPT TH TNGX TWNK UNH WING WRBY
Criteria: price above $5, market cap above $1B, above 20d sma, above 50d sma, average volume above 400k, QoQ sales growth above 0%, EPS growth next year above 0%
Below the paywall is my current trading portfolio including all positions (open & closed), watchlists, charts, entry prices, stop losses, YTD performance and my daily webcasts.