Trading the Charts for Wednesday, November 29th
In order to read this entire newsletter you’ll need to become a paid subscriber by clicking the button below. Paid subscribers get full access to my trading portfolio (up +81.8% YTD), watchlists with charts, daily activity (buys & sells plus entry prices & stop losses, performance, etc) and my daily webcasts.
I also run a Stocktwits room where I post throughout the day about my investment portfolio (up +114.3% YTD) with full access to my holdings, performance, daily activity, market commentary, quarterly earnings analysis, daily webcasts and more.
Here are my deep dive newsletters…
Commentary…
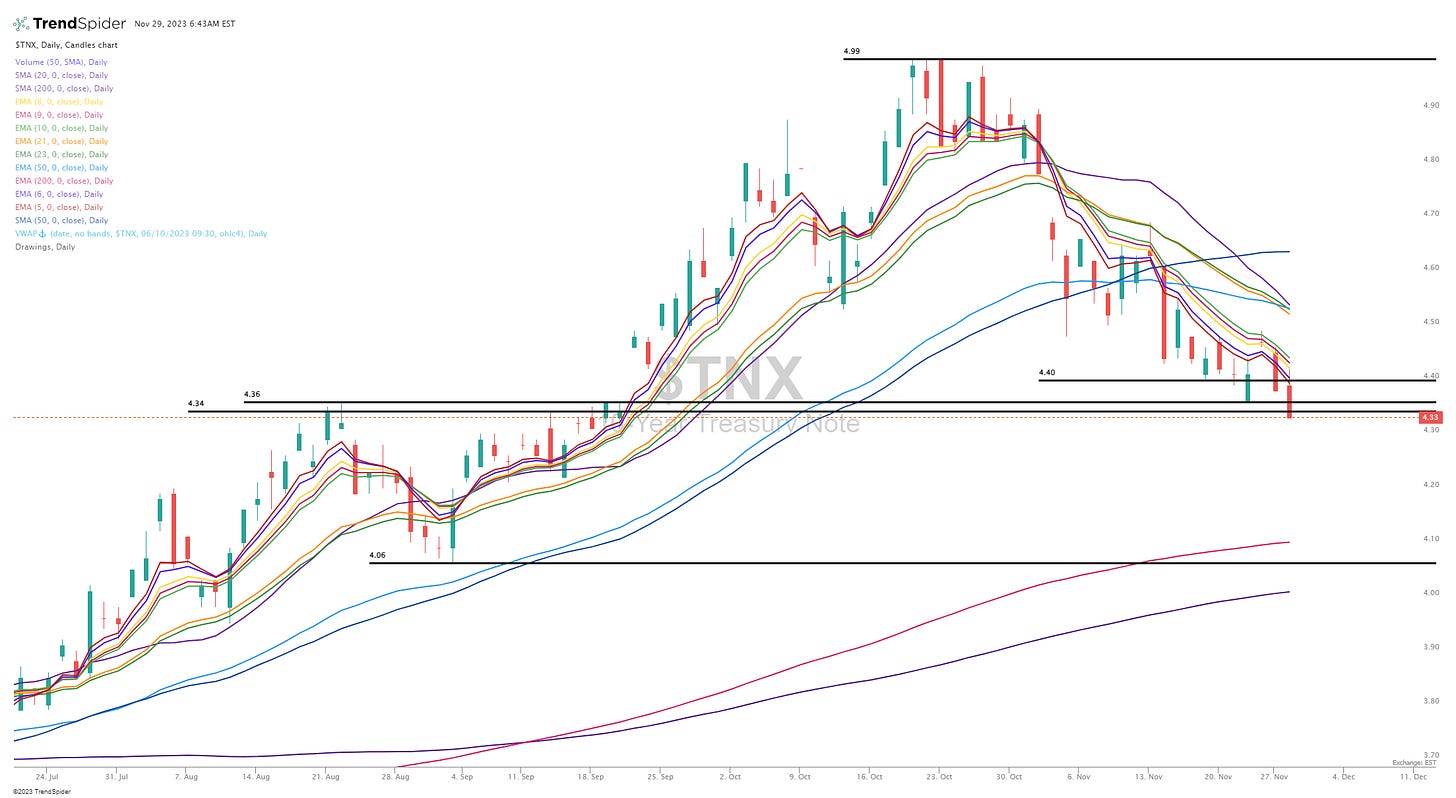
10Y yield did get below 4.28% this morning but now it’s sitting at 4.3% as I write this. If rates continue to stay below 4.36% that could keep this equity rally going a little longer. We’re seeing some minor, healthy pullbacks and consolidations which presents opportunities to jump back into some of the leaders. Lots of breakouts almost every day so the dilemma becomes which ones to take and how many to take because it’s hard to get into all of them and even if you do there’s a good chance that some reverse and turn into failed breakouts which means should I be keeping my stop loss below my entry price or move it above the entry price as quickly as possible so that any reversal results in a small gain instead of risking a small loss. I’ve been doing the former and being aggressive with my stops, I keep waiting for that big intraday selloff but so far it has not happened, not sure what might spark it. We started to get a selloff yesterday on the disappointing 7-year bond auction but most of the stronger stocks held up well, we saw some fading/reversals into the close. Watchlist is over 40+ stocks again today because there’s a ton of great setups… recent leaders pulling back to 5/6d ema and potential leaders in breakout mode. I like these setups especially from the stocks that gapped up after Q3 earnings and now pulling back into their moving averages after 1-2 weeks of consolidation.
As always… my watchlists, daily charts and current trading portfolio are below the paywall down below… [subscribe here] to become a paid subscriber and get full access.
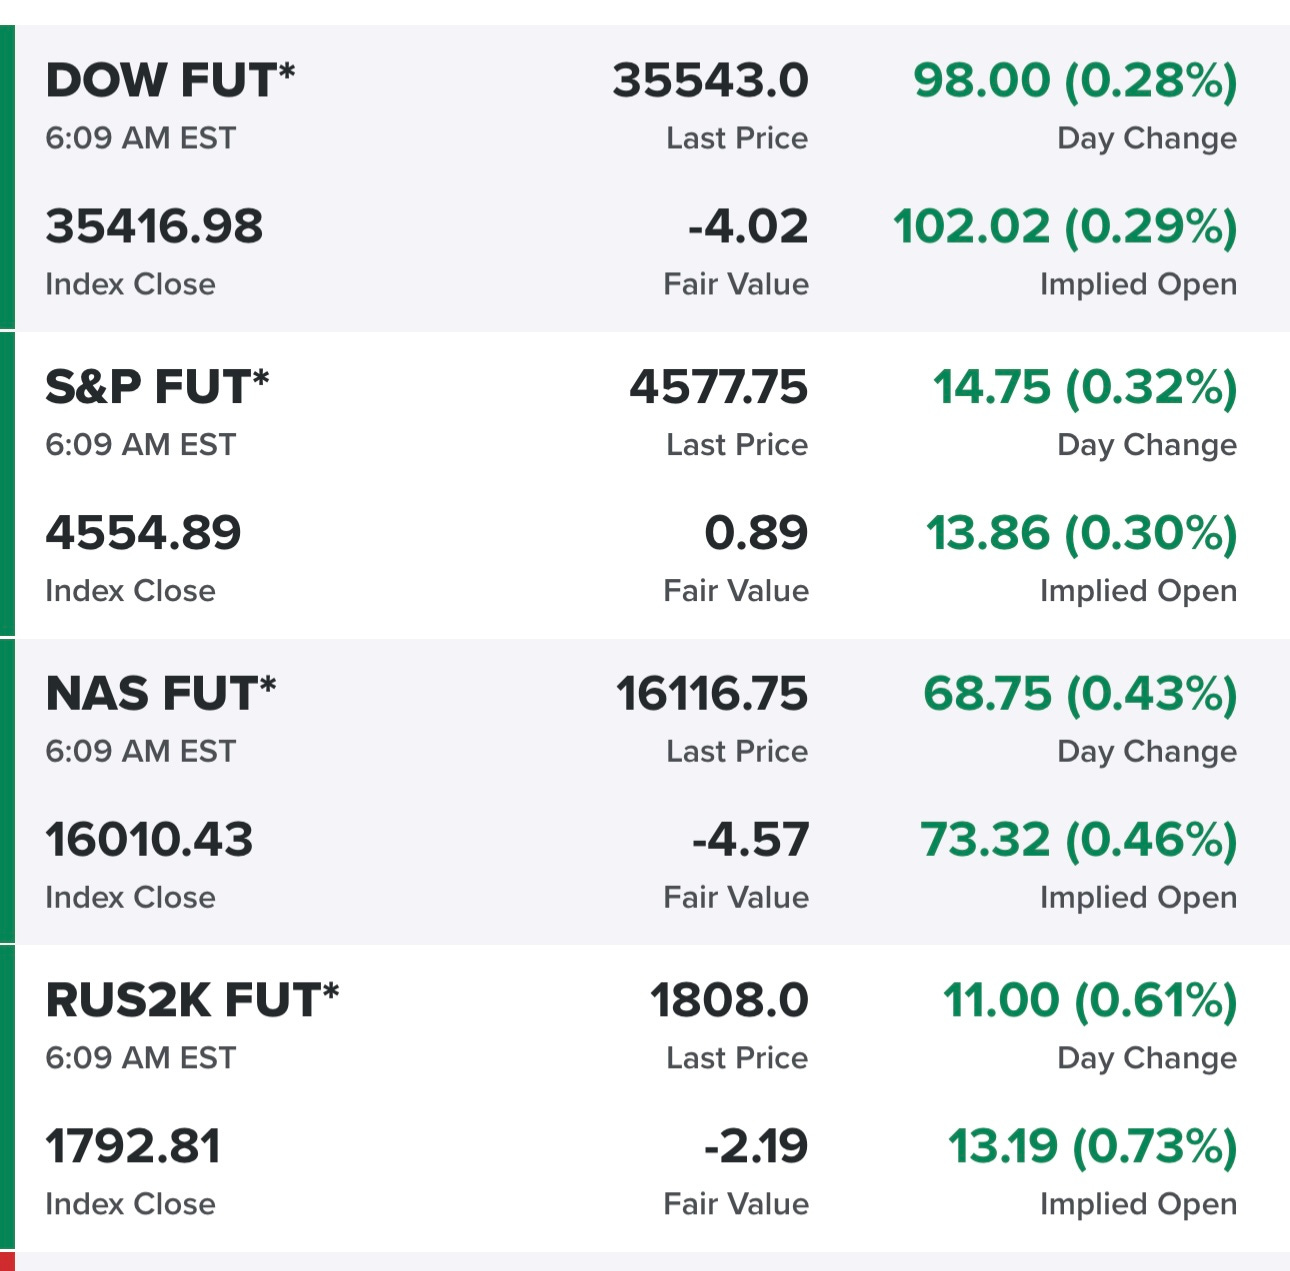
Equity futures…
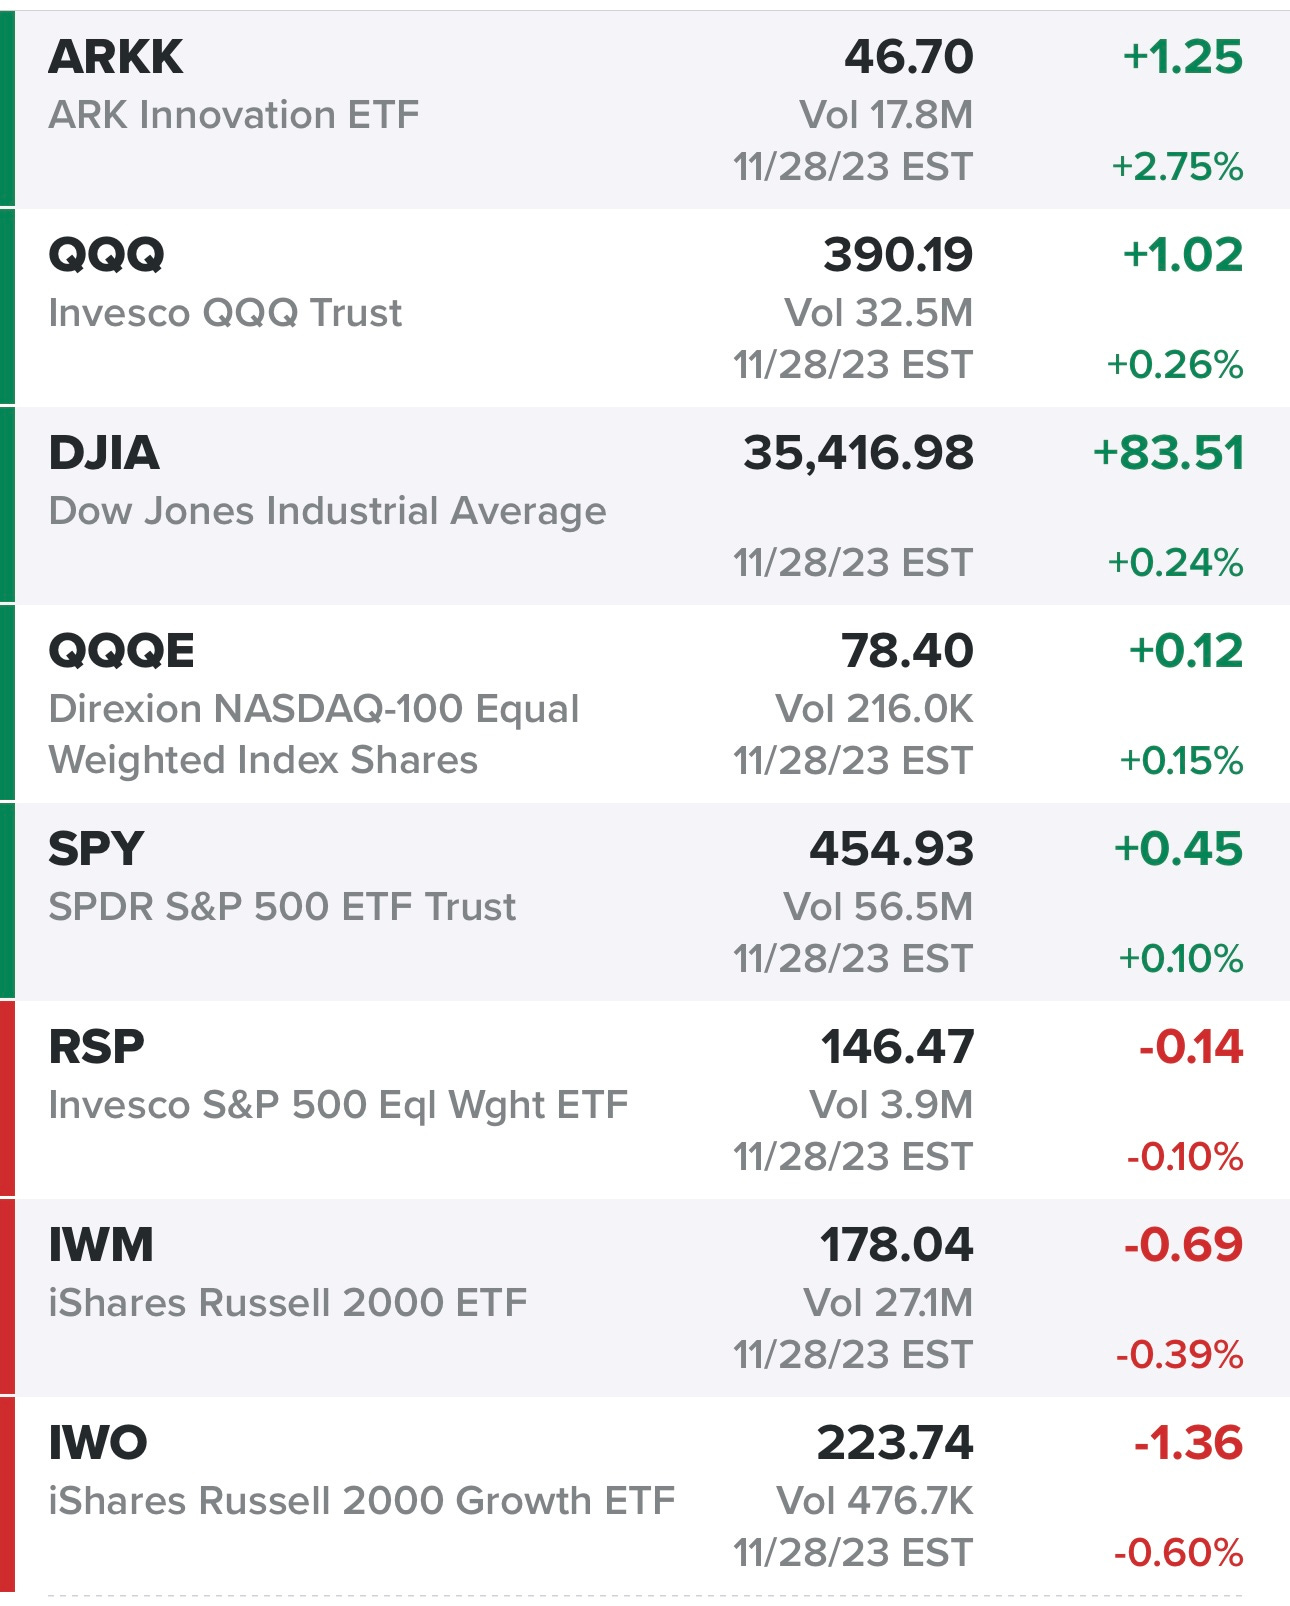
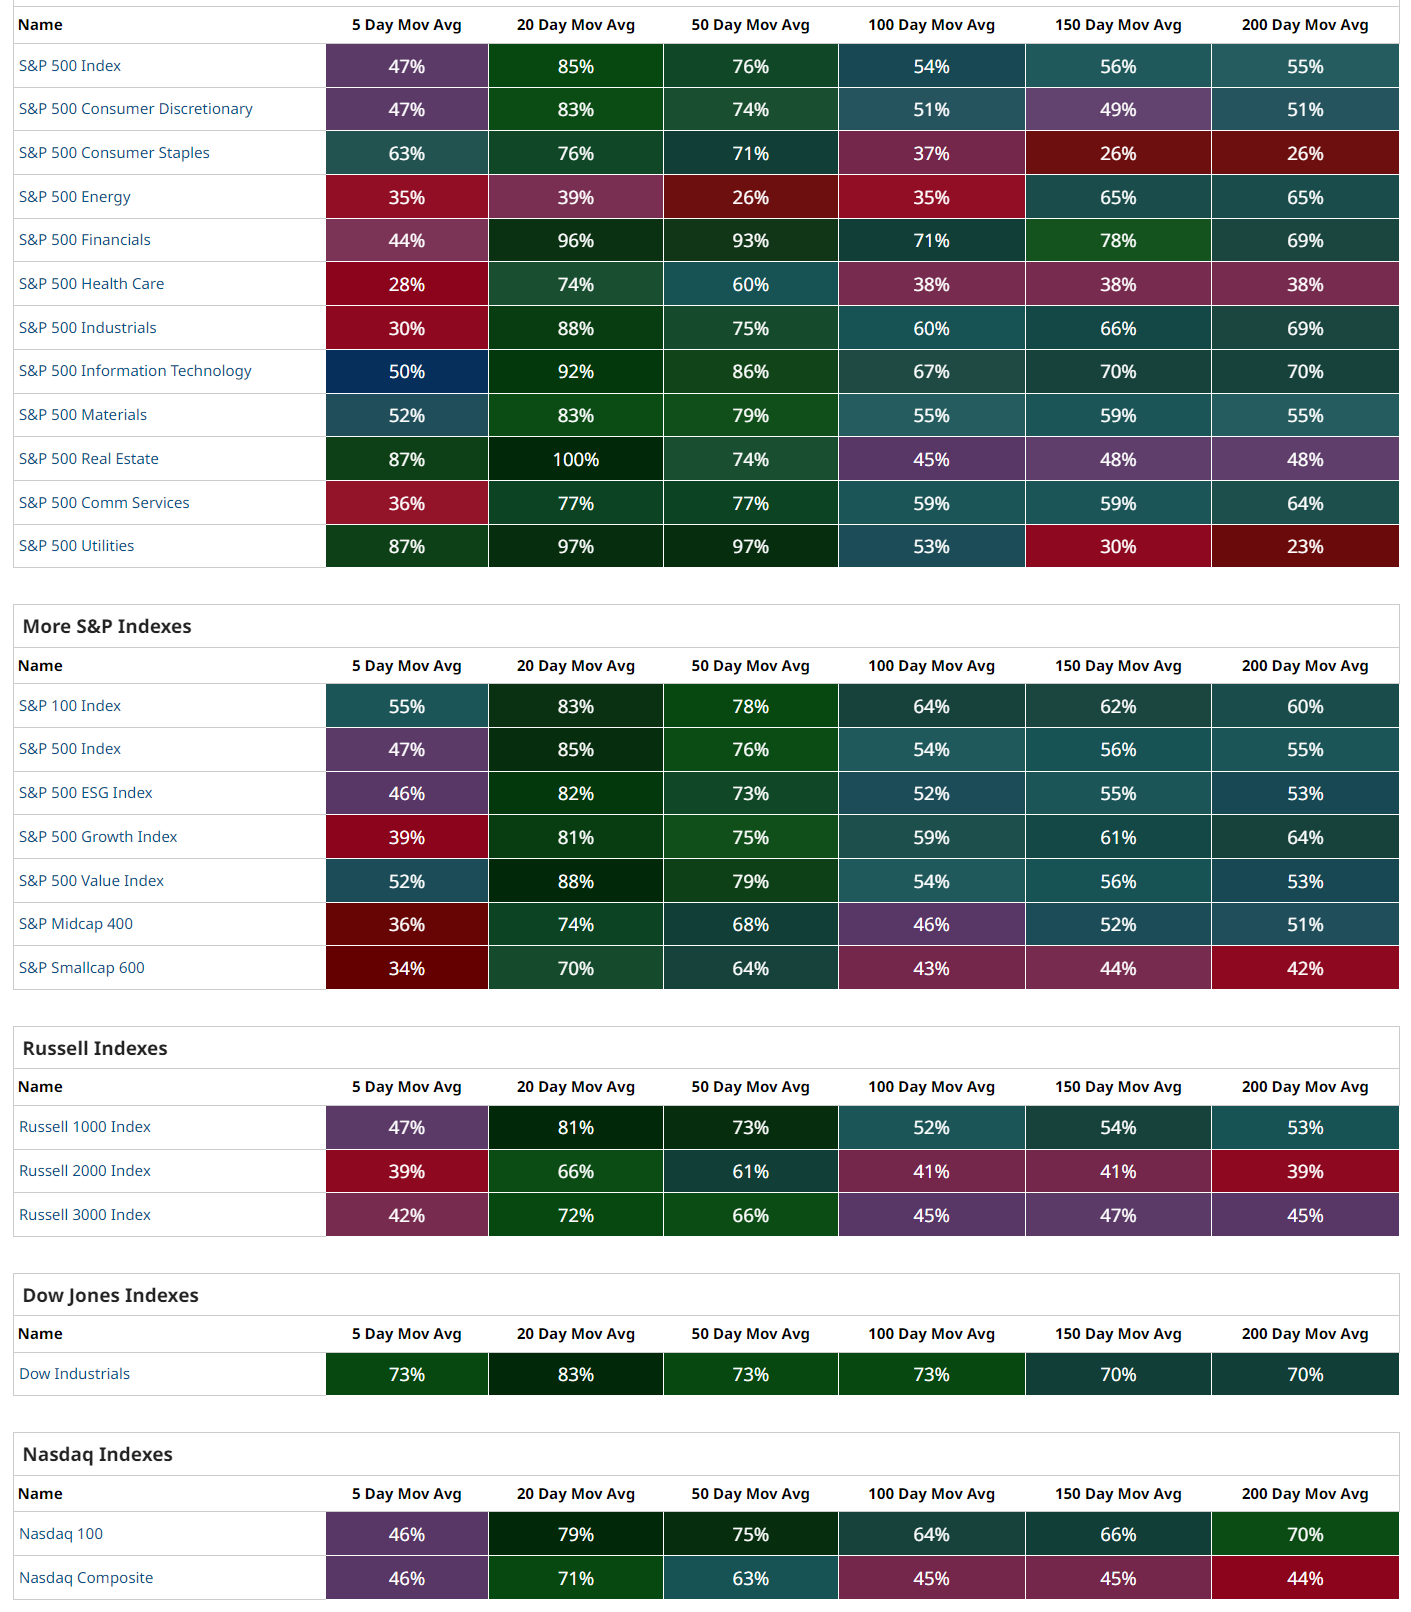
Indexes from yesterday…
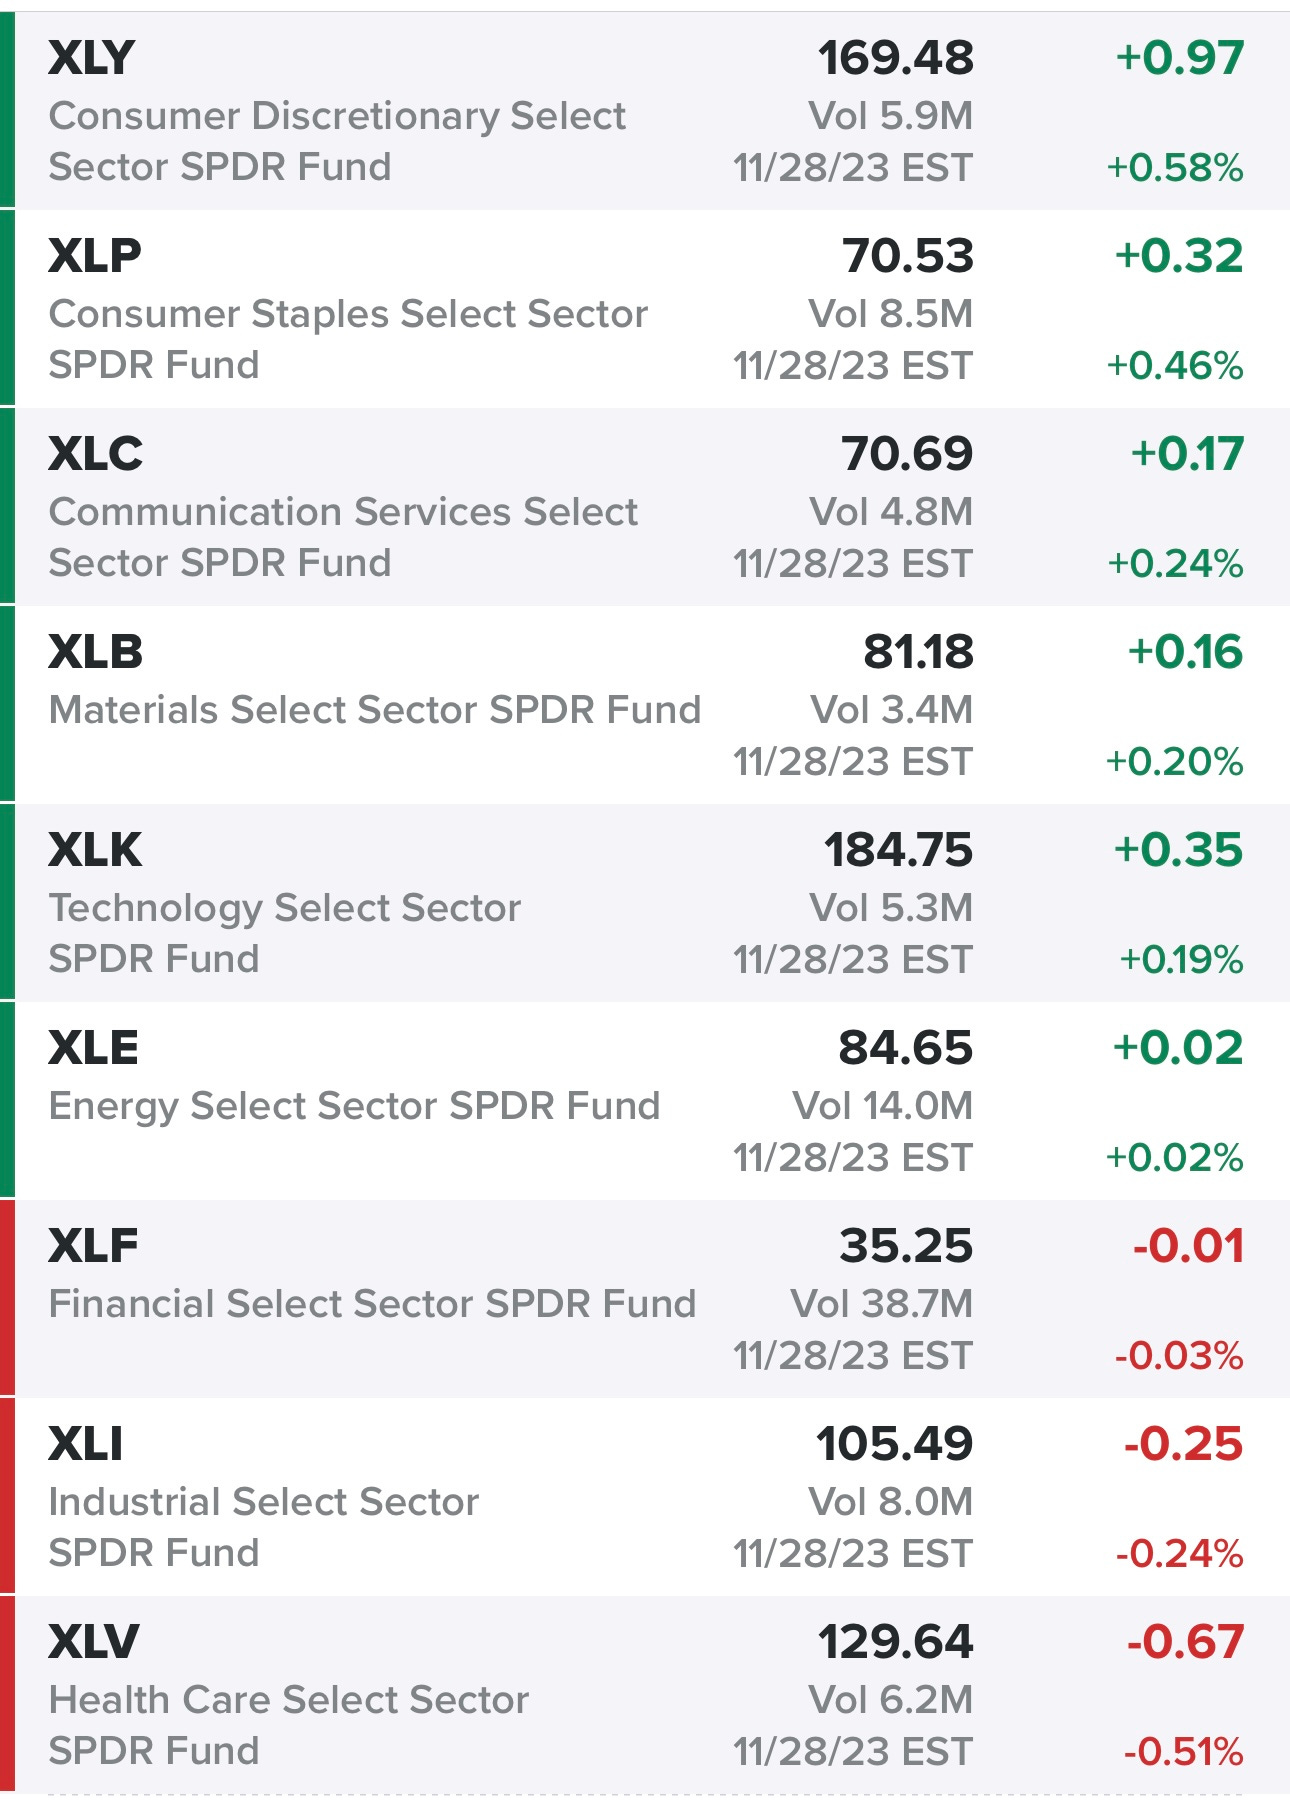
Sectors from yesterday…
Rates…
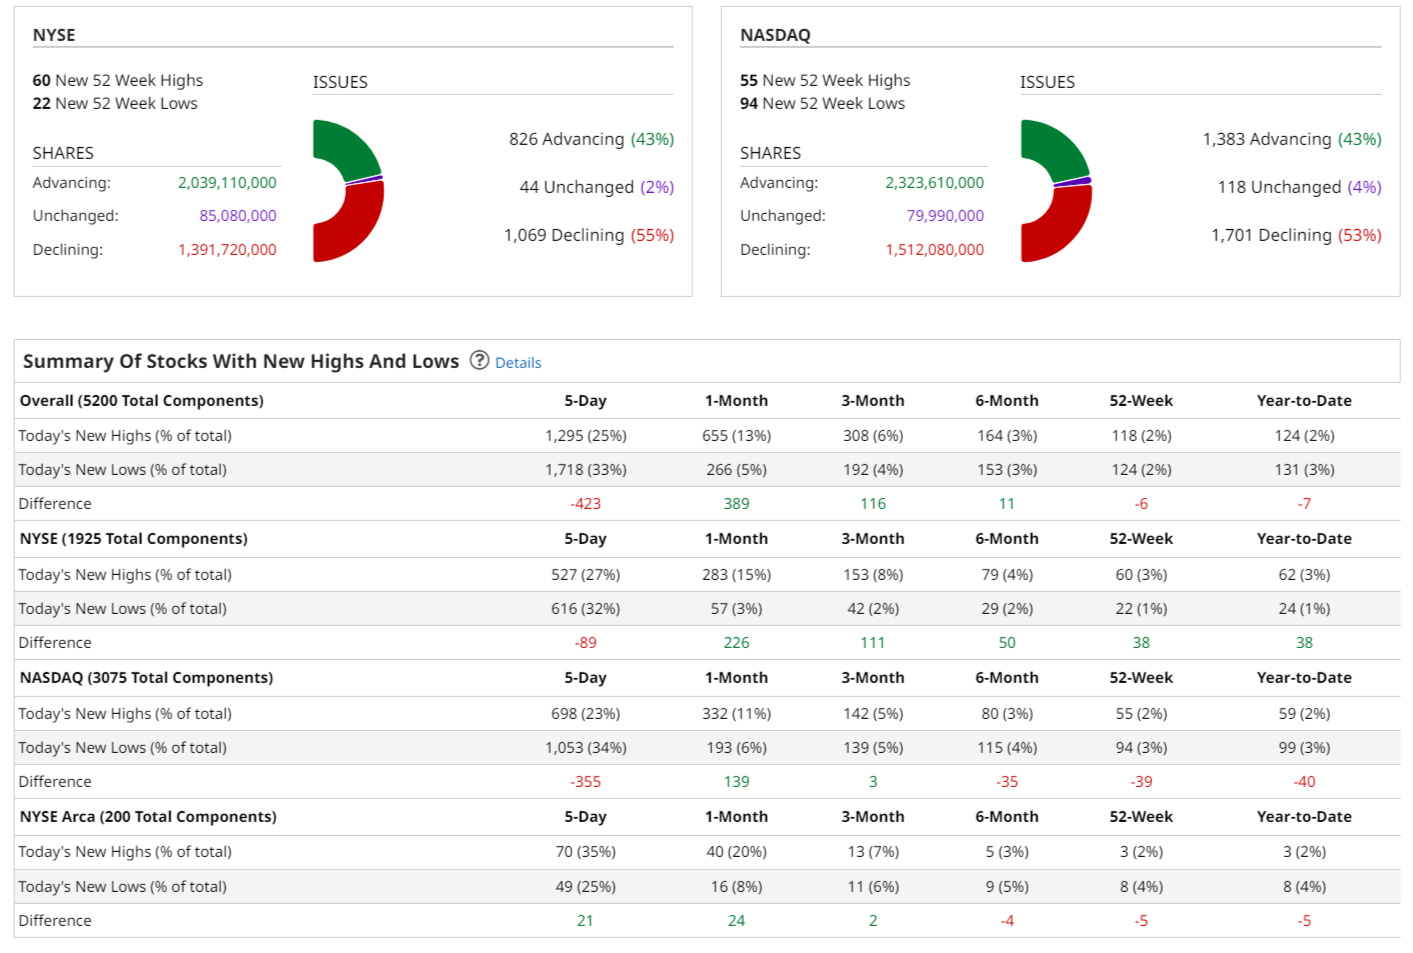
New highs vs new lows…
Market performance…
$TNX
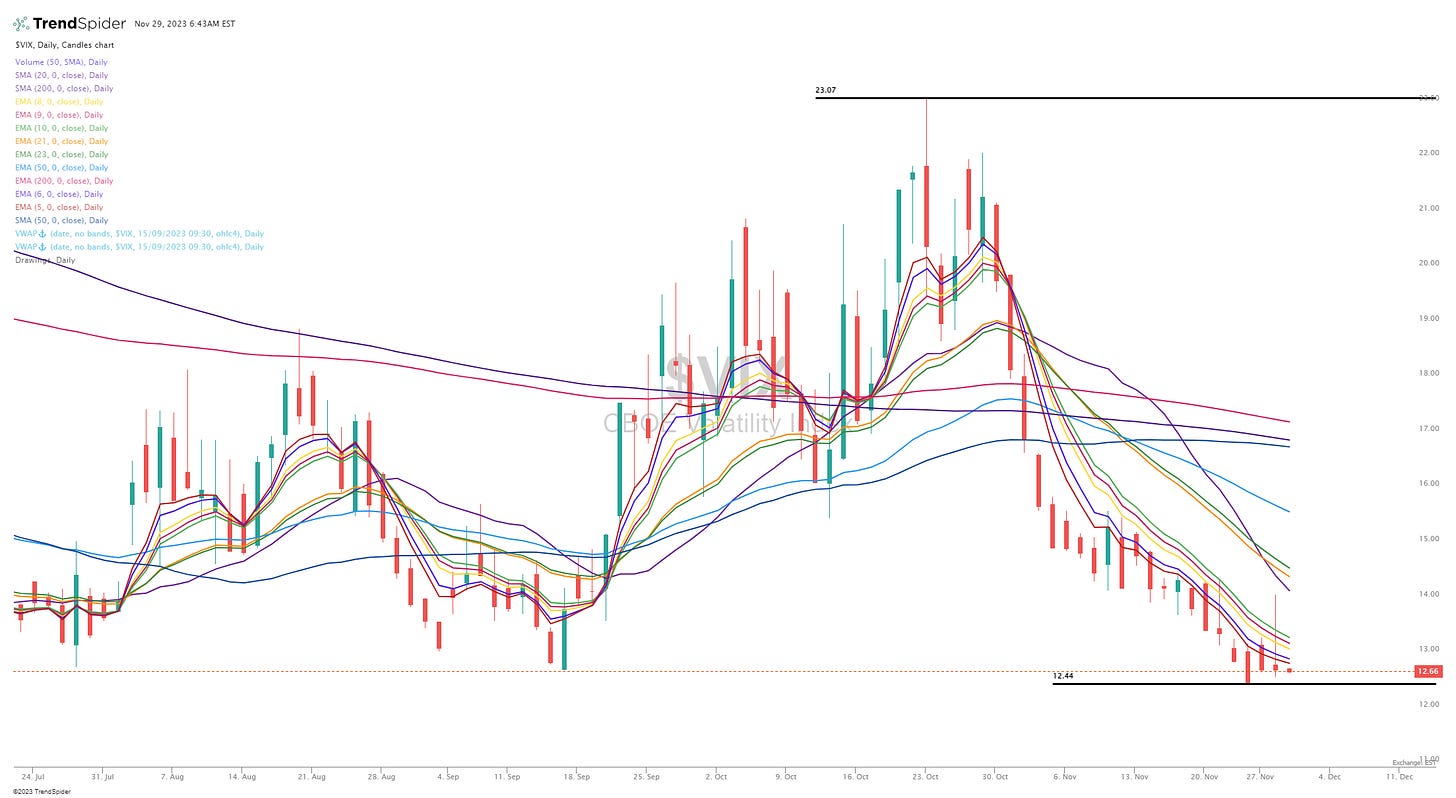
$VIX
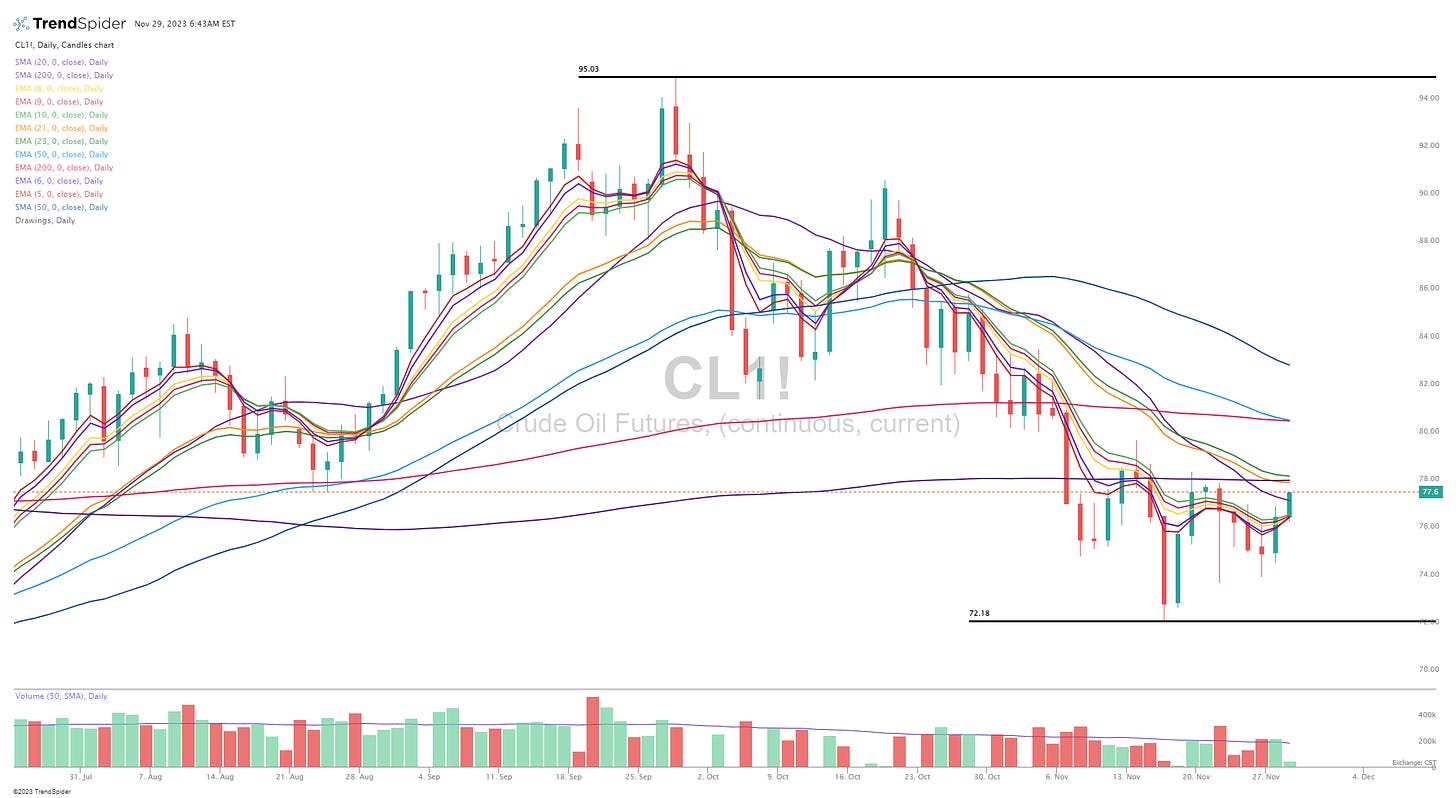
$CL1!
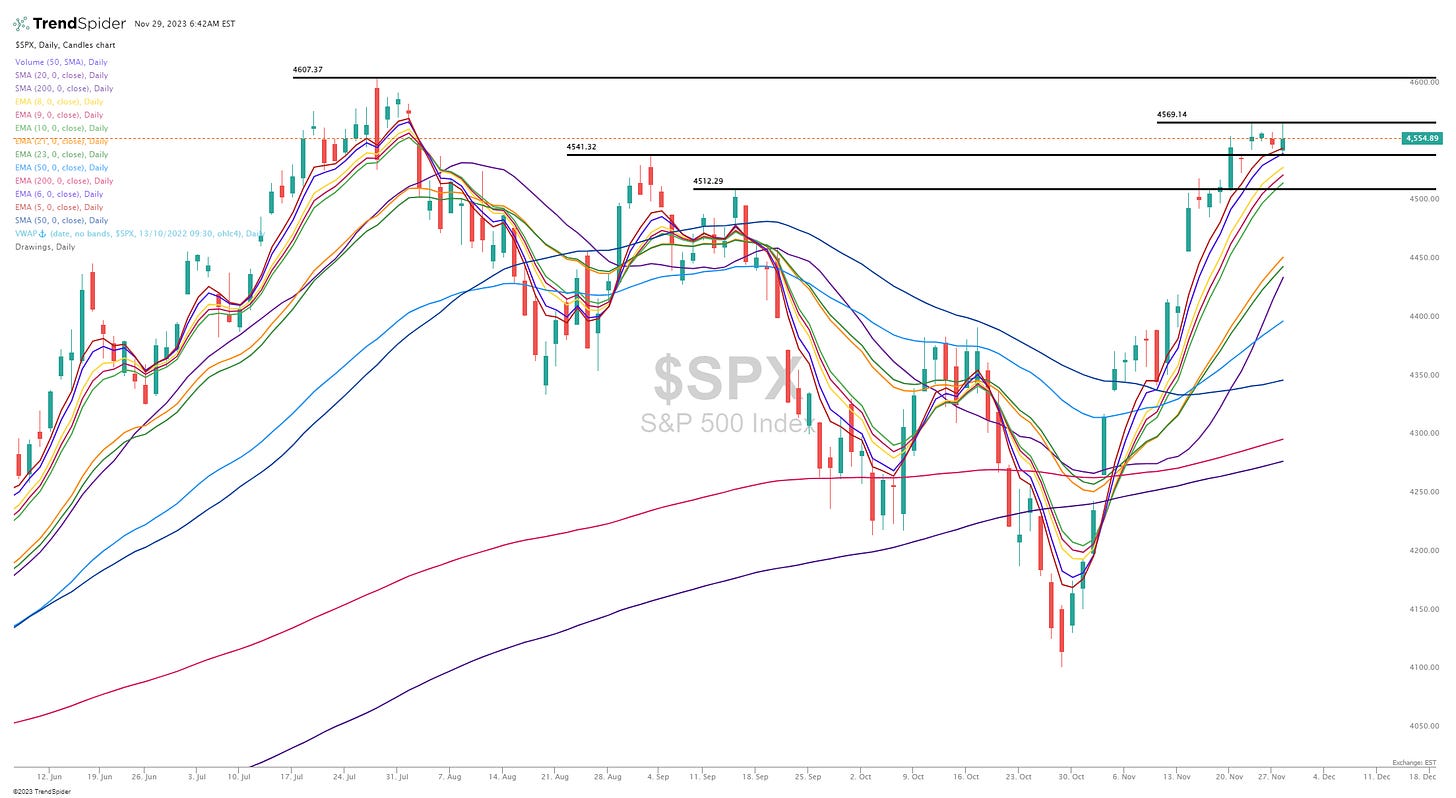
$SPX
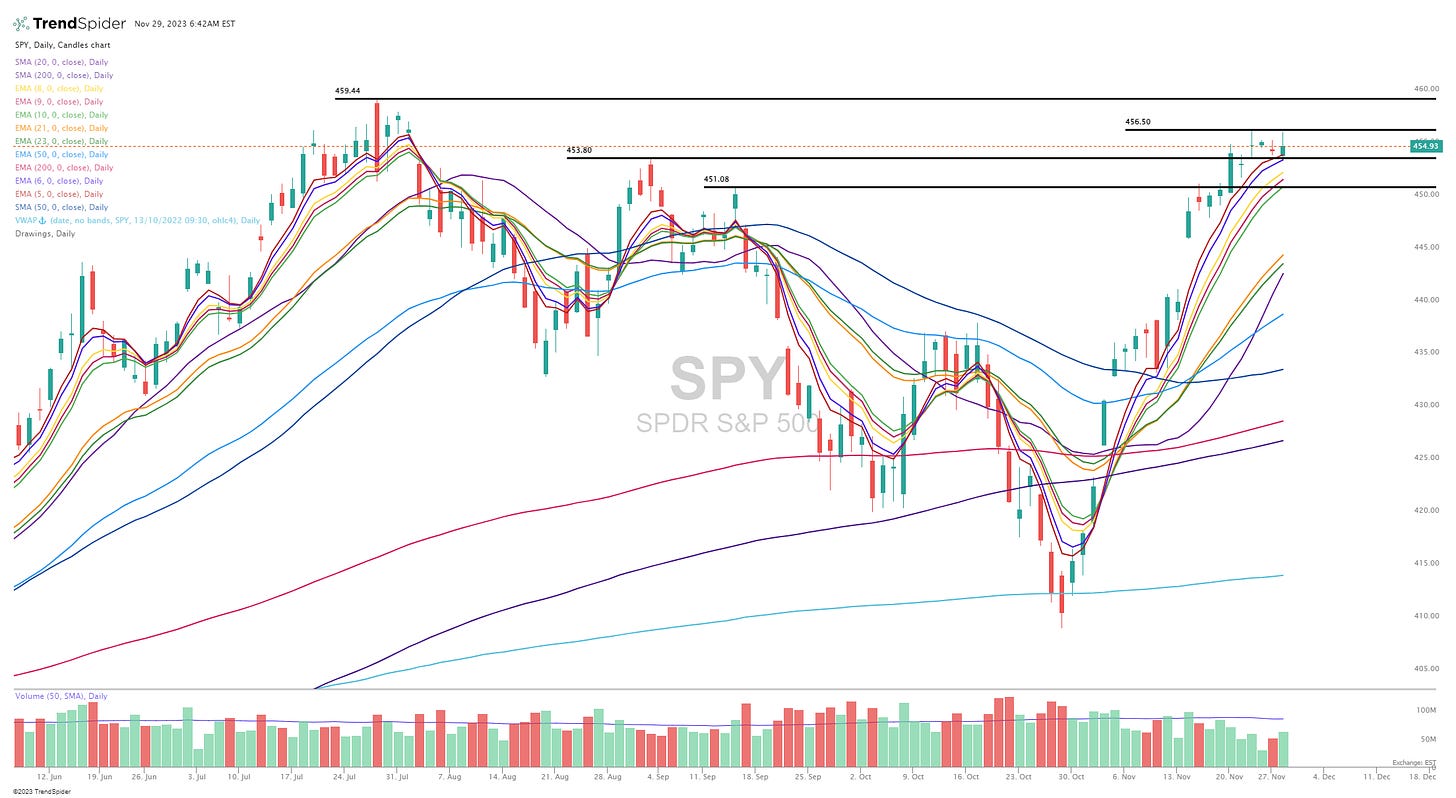
SPY
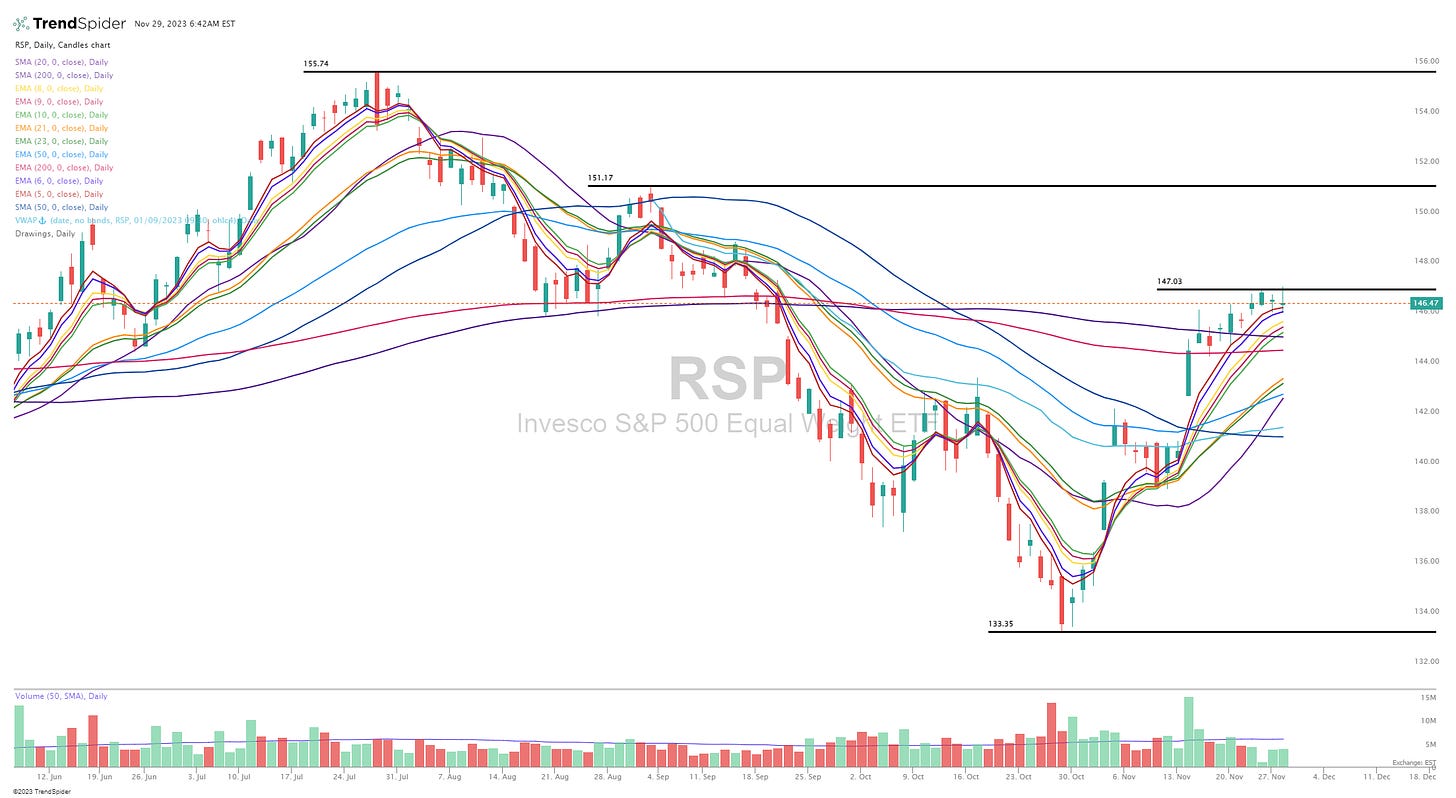
RSP
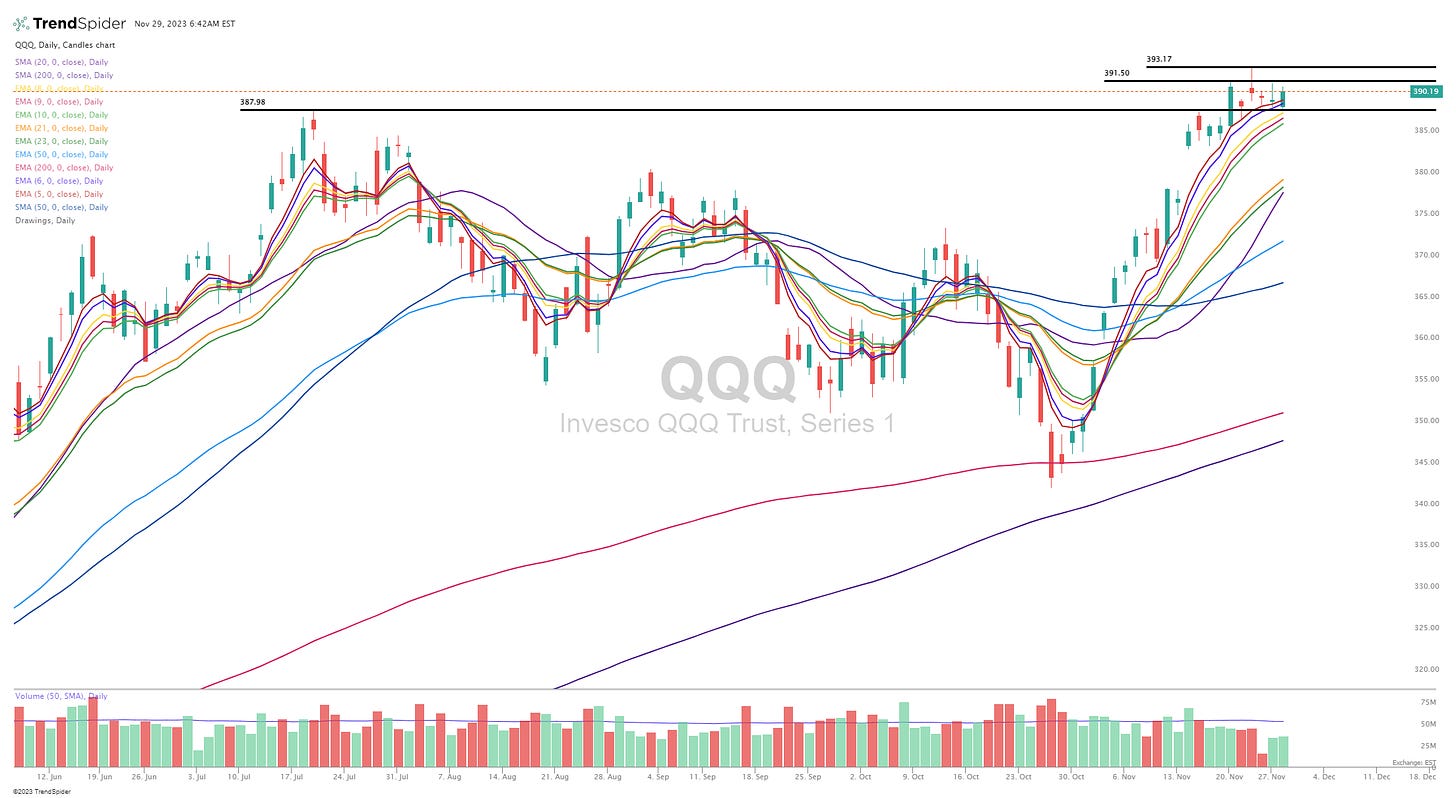
QQQ
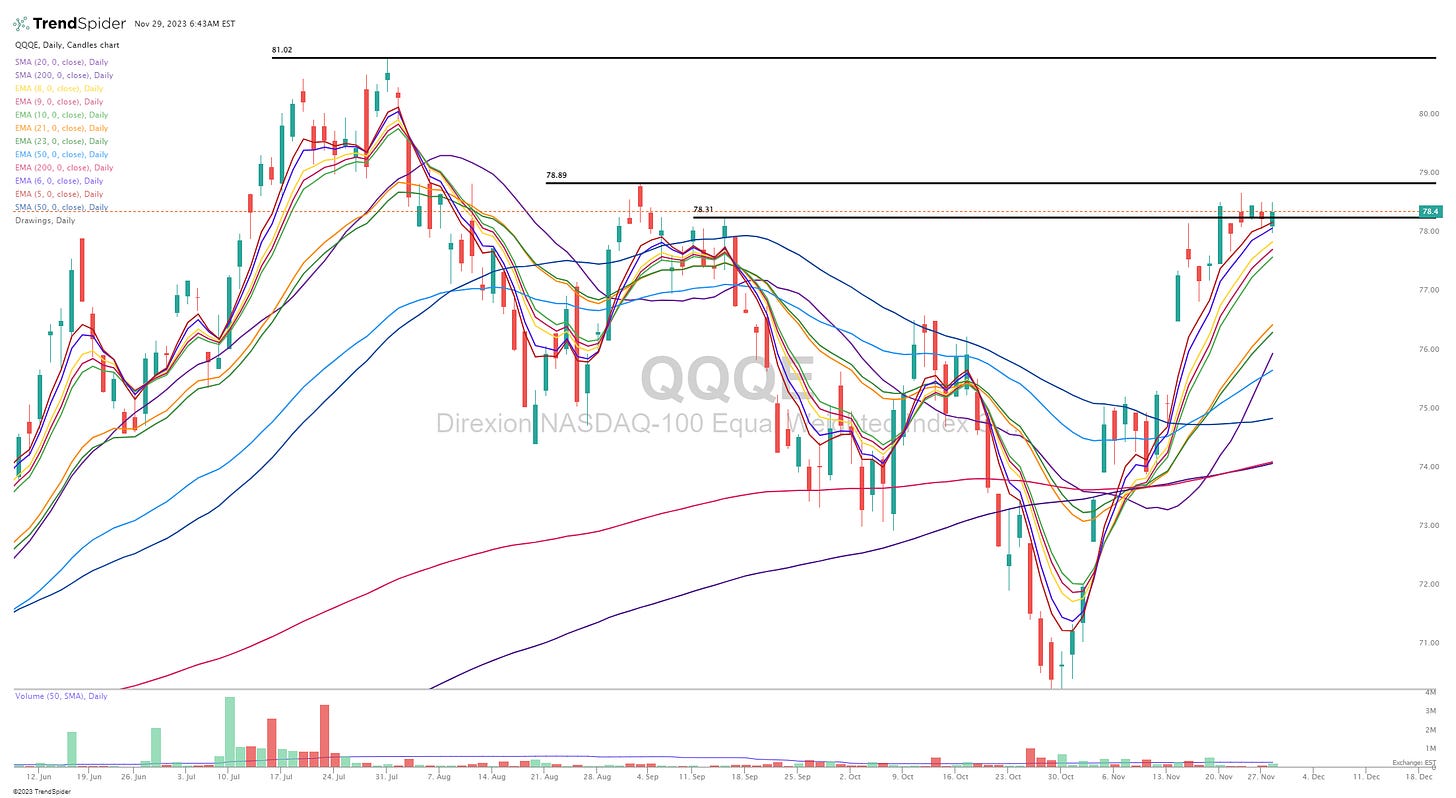
QQQE
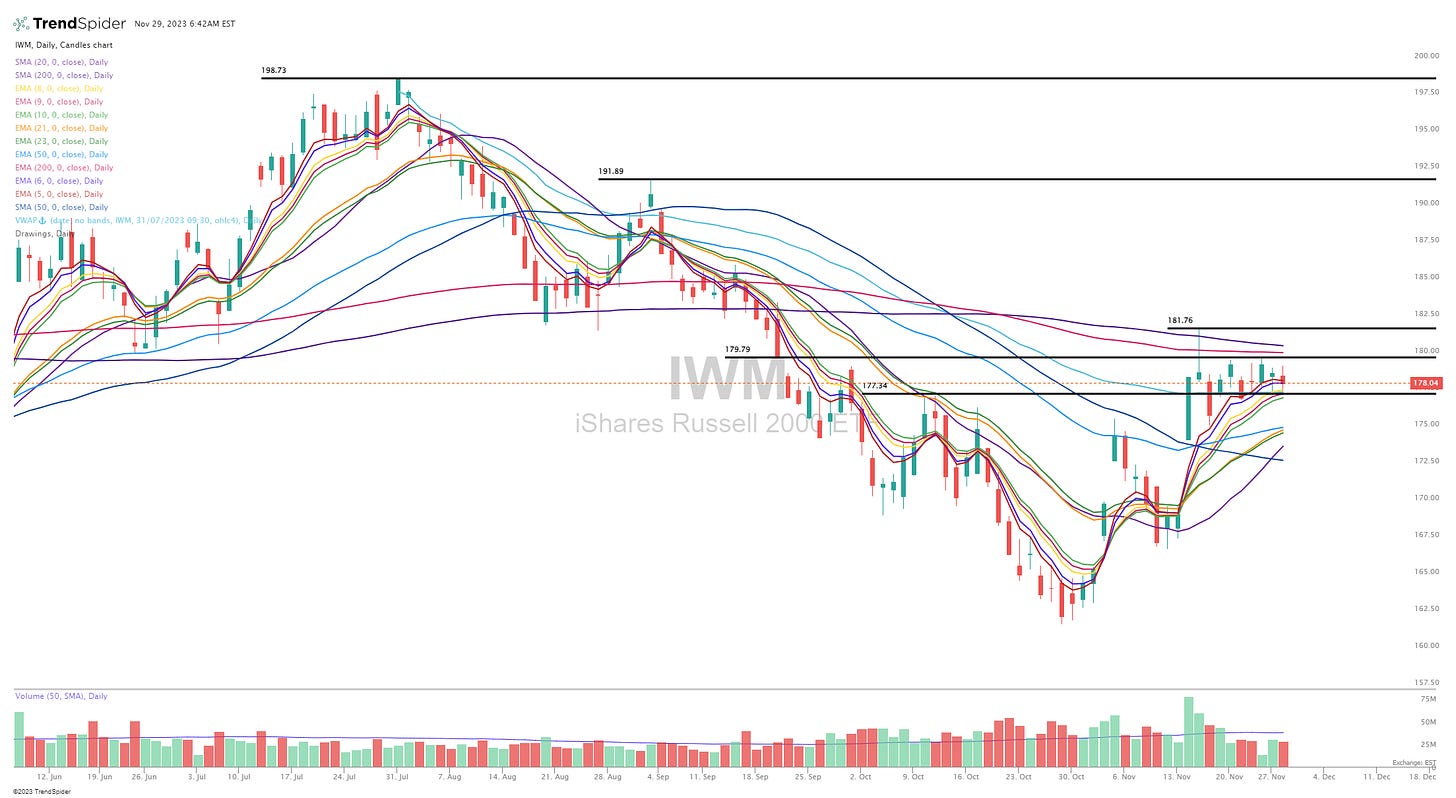
IWM
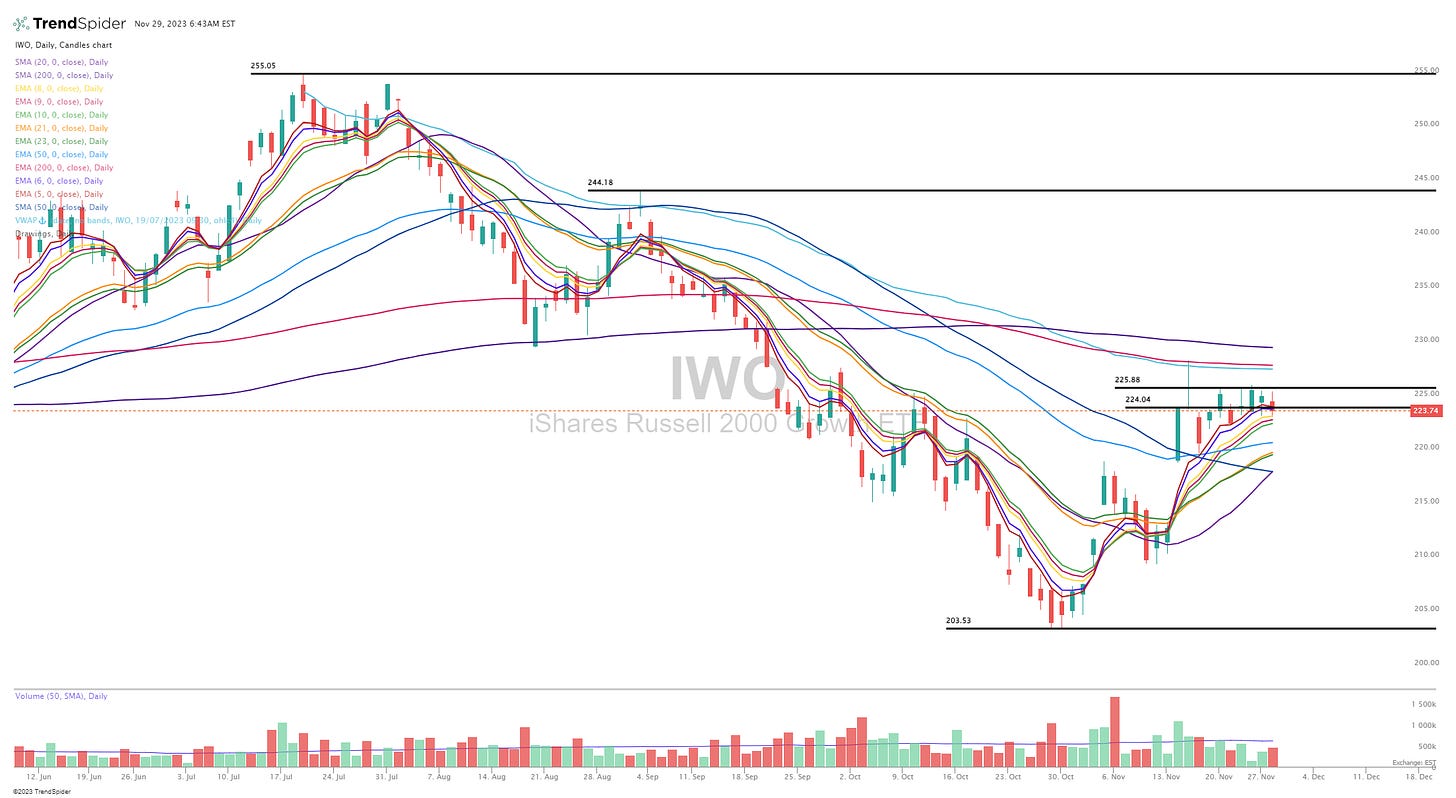
IWO
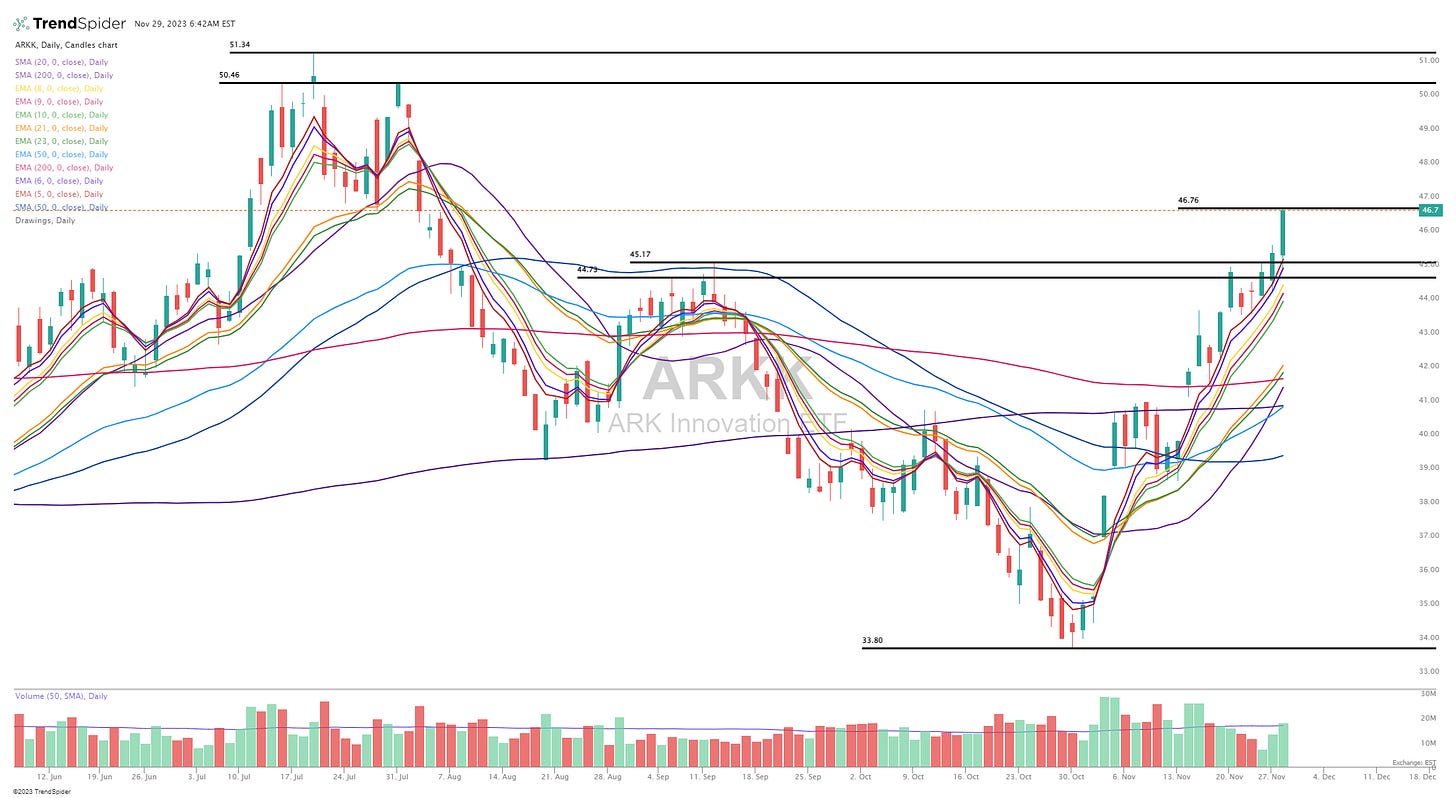
ARKK
Deepvue screen #1: ABNB AEM AER AFRM AMD AMKR ANET APG APH APLE APO ARCC ARMK ASAI ASAN ATI AVGO AXP BAC BK BMA BN BRBR BRZE BUR BXMT BXSL CADE CCJ CCL CDNS CLS CNM COF COLB COUR CRM CRS CRWD CSX CUK CWAN CXM CYBR DASH DDOG DKNG DRS DT DV DXCM EC ELF ENLC ENTG EPR EQH ESMT ET ETR EURN EXPE FAST FIVN FLEX FOUR FRO FRPT FRSH FSK GEN GT GTLB H HALO HLT HSBC HST IMGN IOT ITUB JPM JXN KBH KMI LBRT LEN LI LNG LULU LYV MA MAR MCHP MDB MELI MNDY MPC MPLX MQ MRVL MUFG NCNO NET NFE NOW NRG NTNX NTRA NU NVT NXPI OBDC OKE OLK ORCL OTEX OWL PAA PAGS PANW PATH PBA PBR.A PCAR PDD PH PHM PK PLTR PNC POST PPC PSTG PSX PWR RBLX RCL RITM RMBS RSG S SBS SGEN SHEL SHOP SKX SMCI SMFG SNOW SNPS SO SPGI SPLK SRC STAG STLD STNE STWD SUZ SYM TEO TIMB TOL TRGP TS TSLA TSM TTE TTWO TWLO TXRH UBER UGP UMC USB USFD VERX VIST VRNS VRRM VVV WBS WDAY WELL WRB XP XPEV YMM YPF ZS ZWS
Criteria: price above $5, market cap above $3 billion, above 50d sma, above 200d sma, average volume above 400k, YoY sales growth above 20%
Finviz screen #1: ABNB ACGL AFRM AGI AJG ALLY ANET APO ARCC ASAN ASML AXP AZEK BAC BAH BBIO BBVA BIRK BK BRBR BRO BRZE BXSL CADE CCJ CCL CE COF COLB CRWD CWAN CX CXM DASH DB DDOG DKNG DLR DT DUOL DV DXCM EBR EDU ELF EQH ESTC EWBC FITB FIVN FMX FRO FRSH FTAI GEN GS GTLB HUBS HUM HWM IMGN ING INVH IOT ITCI ITUB JPM KEY KGC KKR LHX LI LLY LULU LYV MBLY MCO MDB MDLZ META MFC MMYT MNDY MUFG NBIX NET NOW NTNX NTRA NU NVDA NVO NVT OBDC OSK OTEX OWL OZK PANW PATH PCAR PDD PGR PLTR PNC PSN PWR RBLX RCL RITM ROKU ROL S SBS SGEN SHOP SMFG SN SNOW SNPS SPOT SQ STNE STWD SYM TAL TEAM TREX UBS UBSI URI USB VIV VRT WAB WAL WBS WDAY WFC WING XP XPEV XYL YMM ZION ZS
Criteria: price above $5, market cap above $3B, above 50d sma, above 200d sma, average volume above 500k, QoQ sales growth above 15%
Below the paywall are my watchlist, daily charts and current trading portfolio including all positions (open & closed), entry prices, stop losses, YTD performance and links to my daily webcasts.


