Trading the Charts for Friday, November 17th
In order to read this entire newsletter you’ll need to become a paid subscriber by clicking the button below. Paid subscribers get full access to my trading portfolio (up +78.9% YTD), watchlists with charts, daily activity (buys & sells plus entry prices & stop losses, performance, etc) and my daily webcasts.
I also run a Stocktwits room where I post throughout the day about my investment portfolio (up +108.4% YTD) with full access to my holdings, performance, daily activity, market commentary, quarterly earnings analysis, daily webcasts and more.
Here are my deep dive newsletters…
Commentary…
We saw some minor pullbacks yesterday but it was healthy and exactly what I wanted to see after I sold most of my winners on Wednesday morning when they were looking exhausted. Then we get some pullbacks to the 5d ema where I start to reload my positions which I started doing yesterday when I got back into PLTR and NVDA, then end of day I got into MELI and TTWO as they pushed through prior resistance. I was ~130% invested at the highs on Wednesday morning, then got own to ~30% yesterday at the lows and then coming into today I’m at ~63%. Over the past few months Friday’s have not been the best but Monday’s have been superb so I’m less scared about taking 80-100% exposure into the weekend but I’d almost never take more than 100% into the weekend.
Macro looks good right now with Q3 earnings in the rear view mirror, CPI coming in lower, PPI coming in lower, FOMC on hold, VIX at ~14, Oil in the low $70s, and most importantly the 10Y now hovering around 4.4% which is down 60+ bps from a few weeks ago. I still think we’re setup for a year end rally but we need to stick with the leaders, the companies that had the strongest Q3 reports because they’re the ones that will see the most outperformance over the next 6 weeks as big funds chase them higher to window dress their portfolios for those year end statements and factsheets.
Next week will be lighter volume because of the holiday week so we could see more volatility in either direction.
As always… my watchlists, daily charts and current trading portfolio are below the paywall down below… [subscribe here] to become a paid subscriber and get full access.
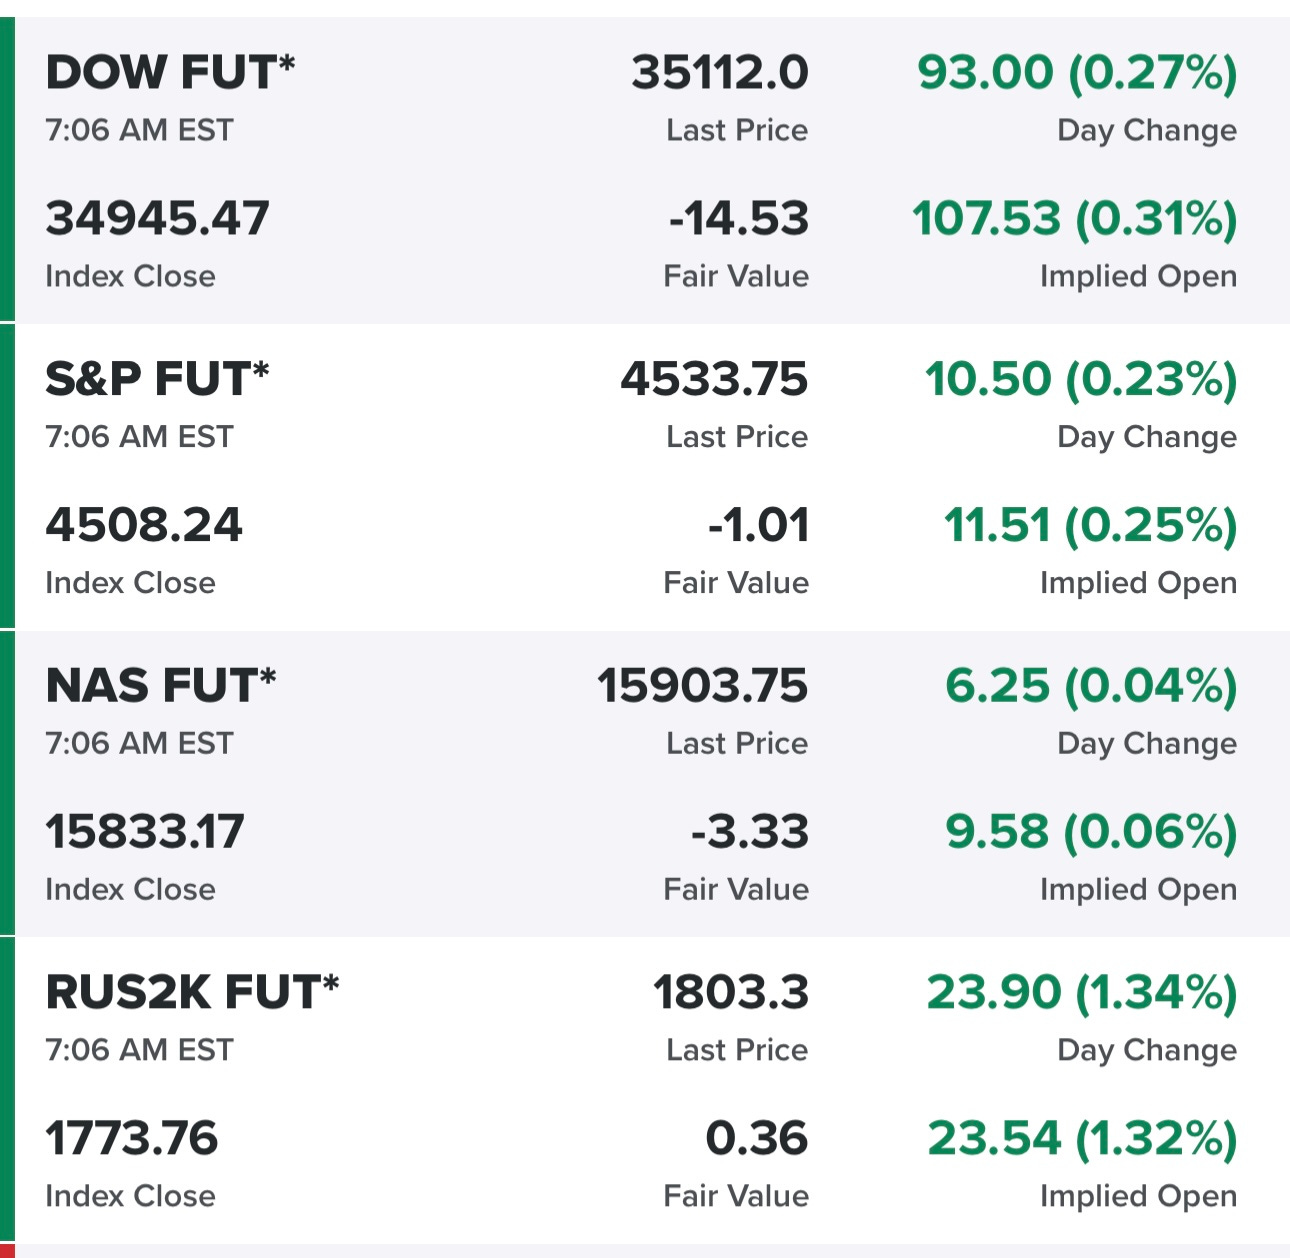
Equity futures in the green…
Indexes from yesterday… small caps, mid caps and growth looked the worse…
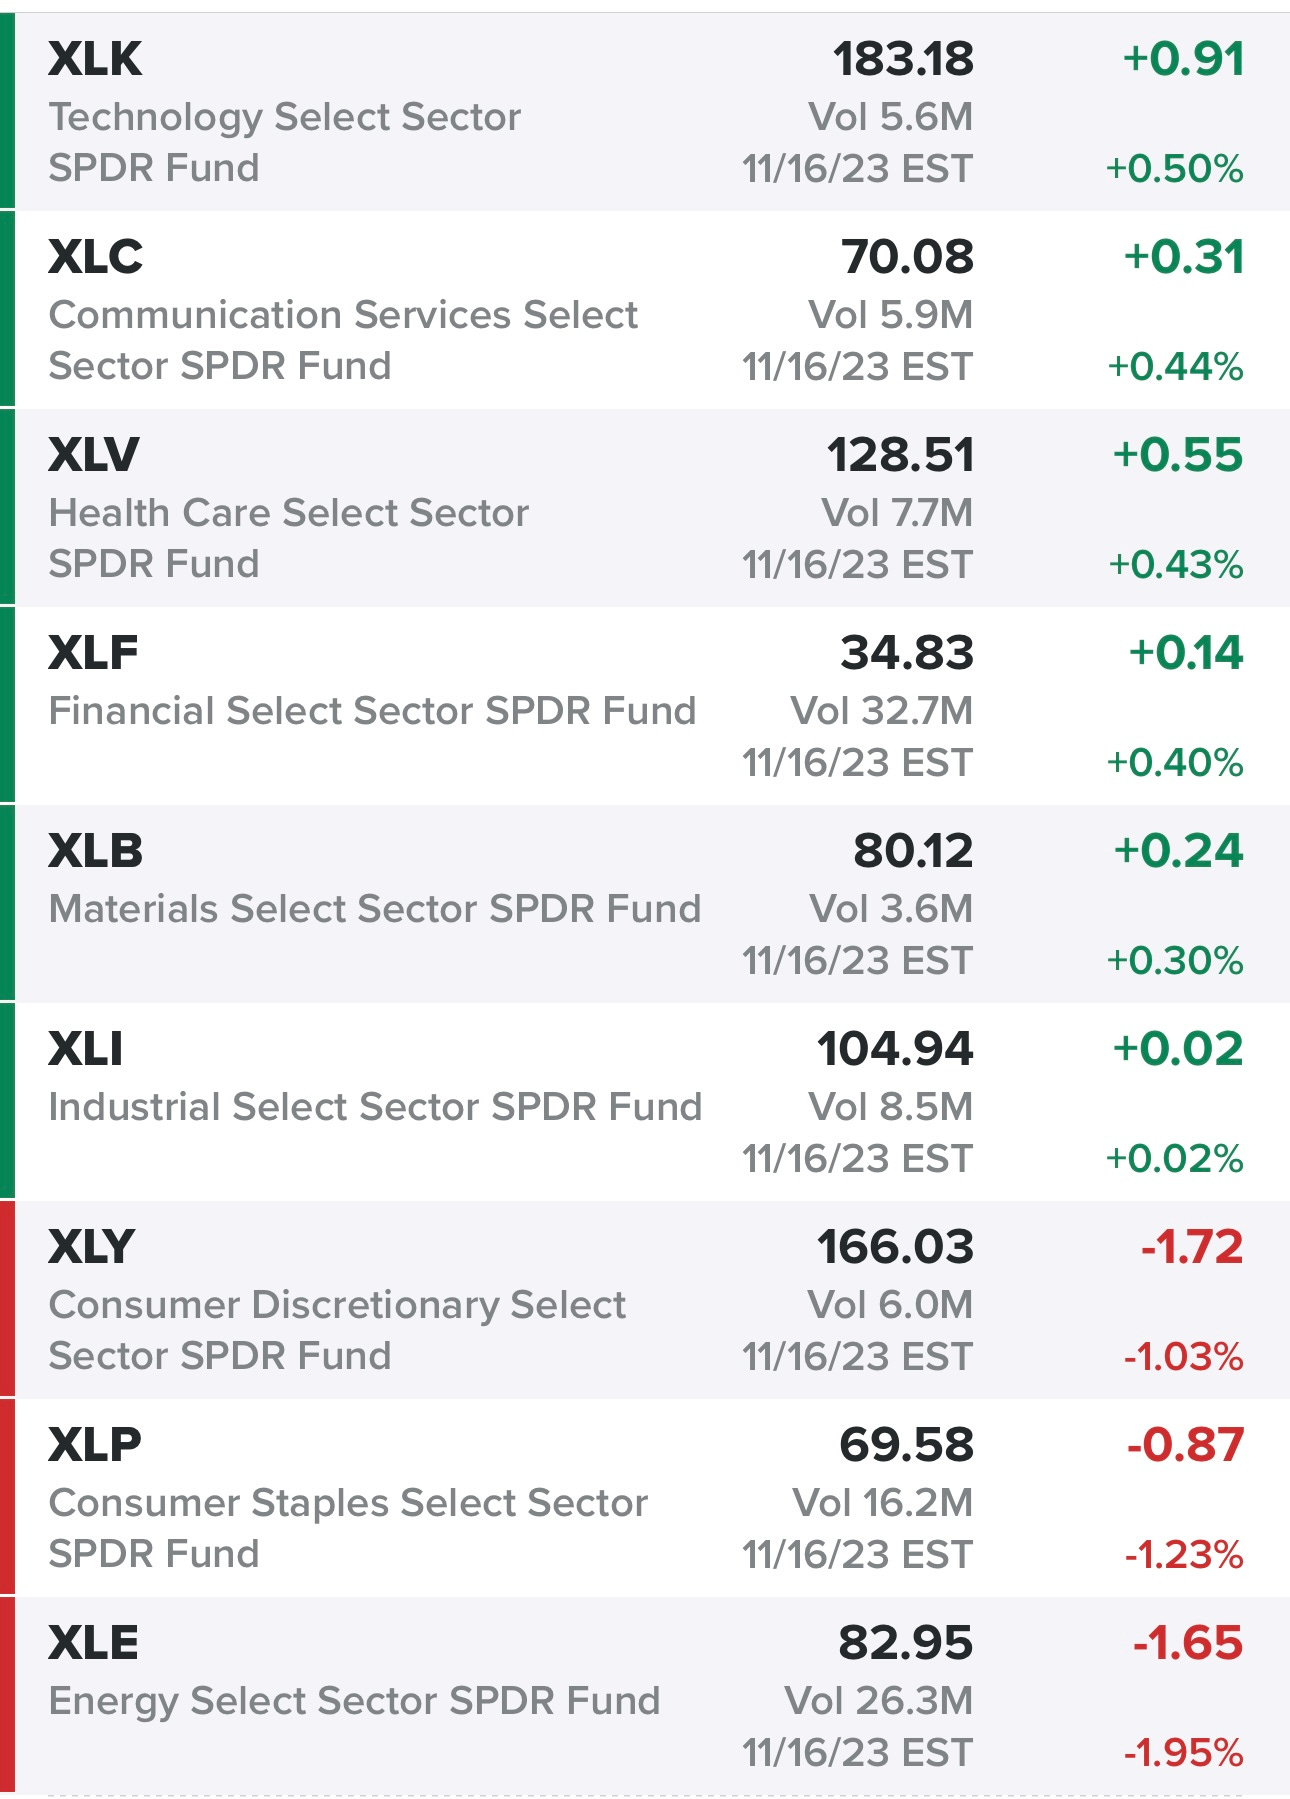
Sectors from yesterday… energy continues to be a mess…
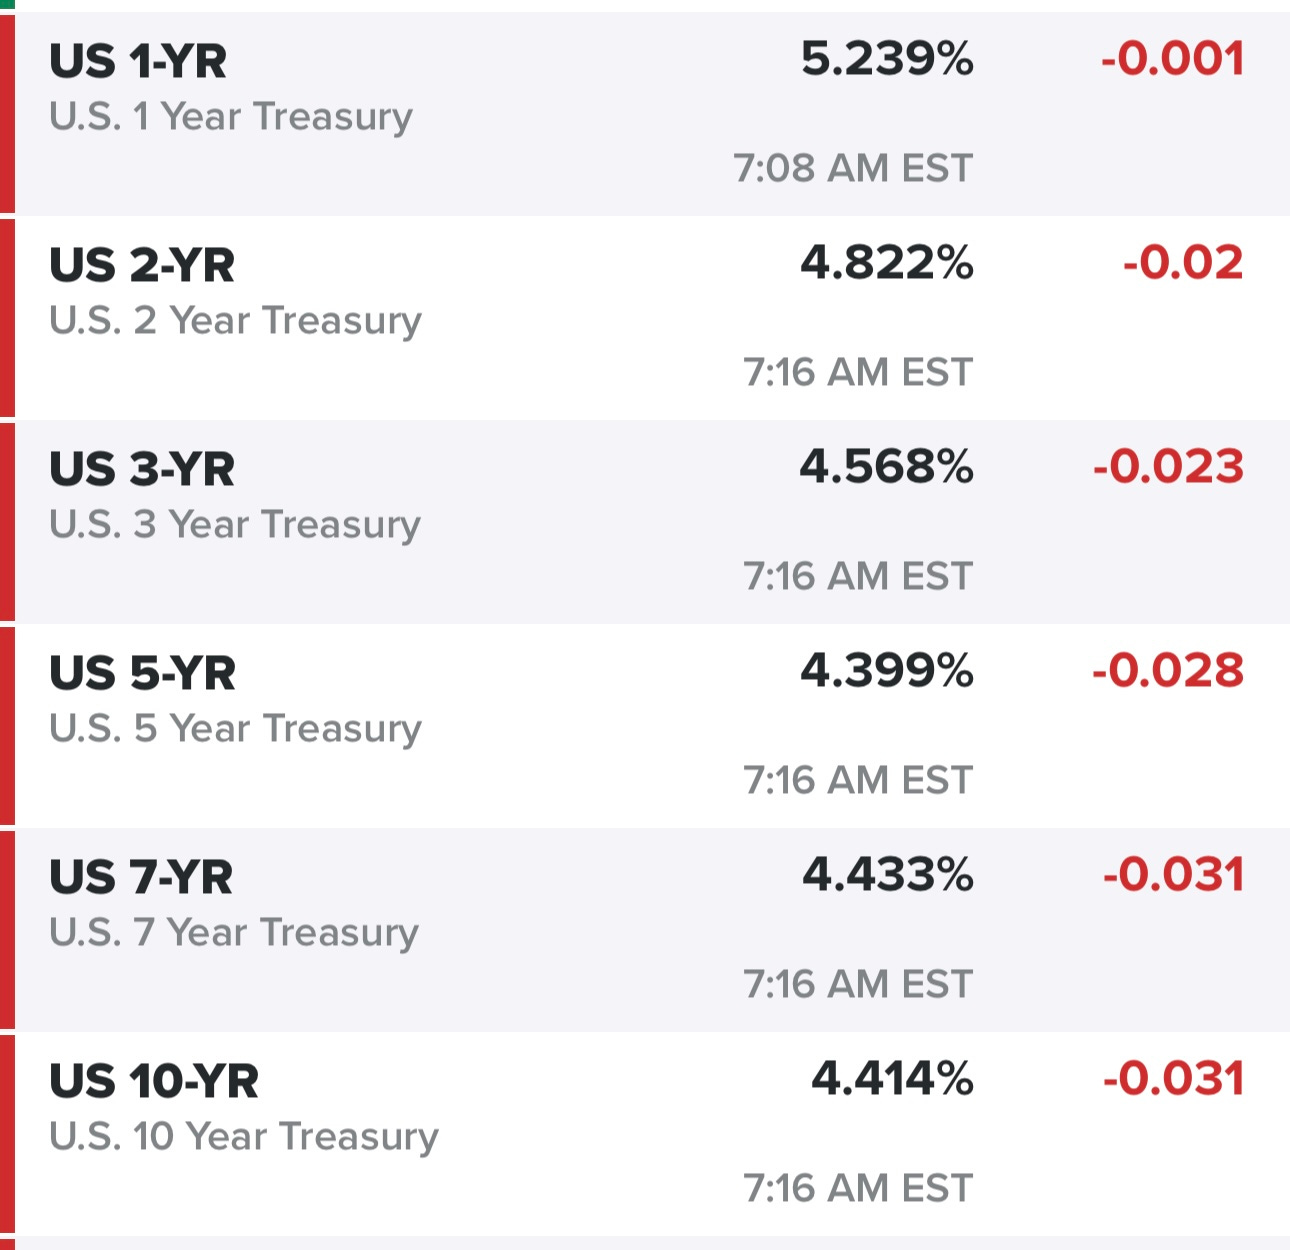
Rates… 10Y was under 4.4% this morning for the first time in ~2 months…
New highs vs new lows…
Market performance…
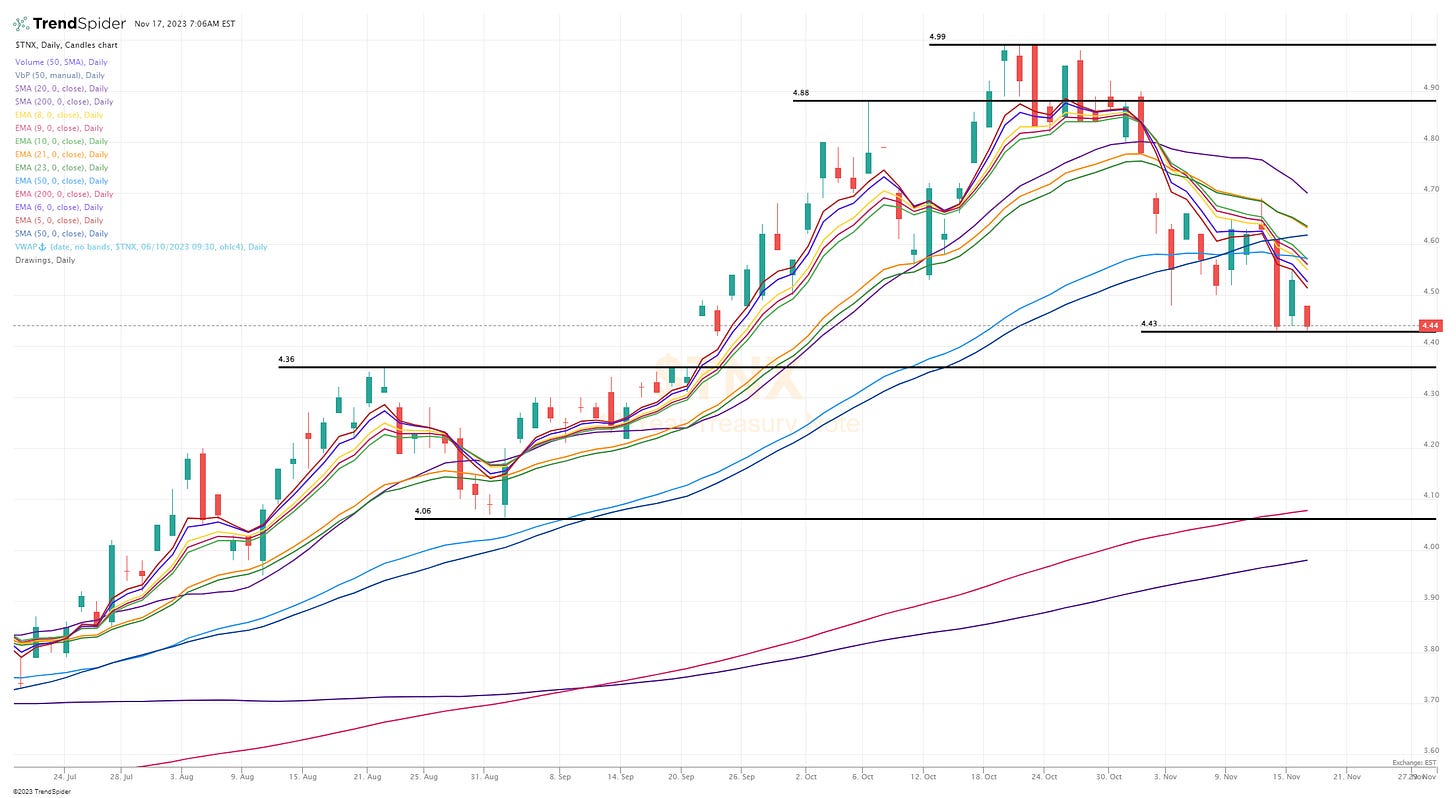
$TNX — (10Y) is trading below 4.40% this morning for the first time in ~2 months however the real test will be what happens at 4.36% which is not only the unfilled gap from September but it's also the August highs. If $TXN slices through 4.36% it's very possible we drop quickly down to ~4.06% with the 200d at ~4.00%
$VIX — not much fear in the markets right now, which means puts are probably cheap
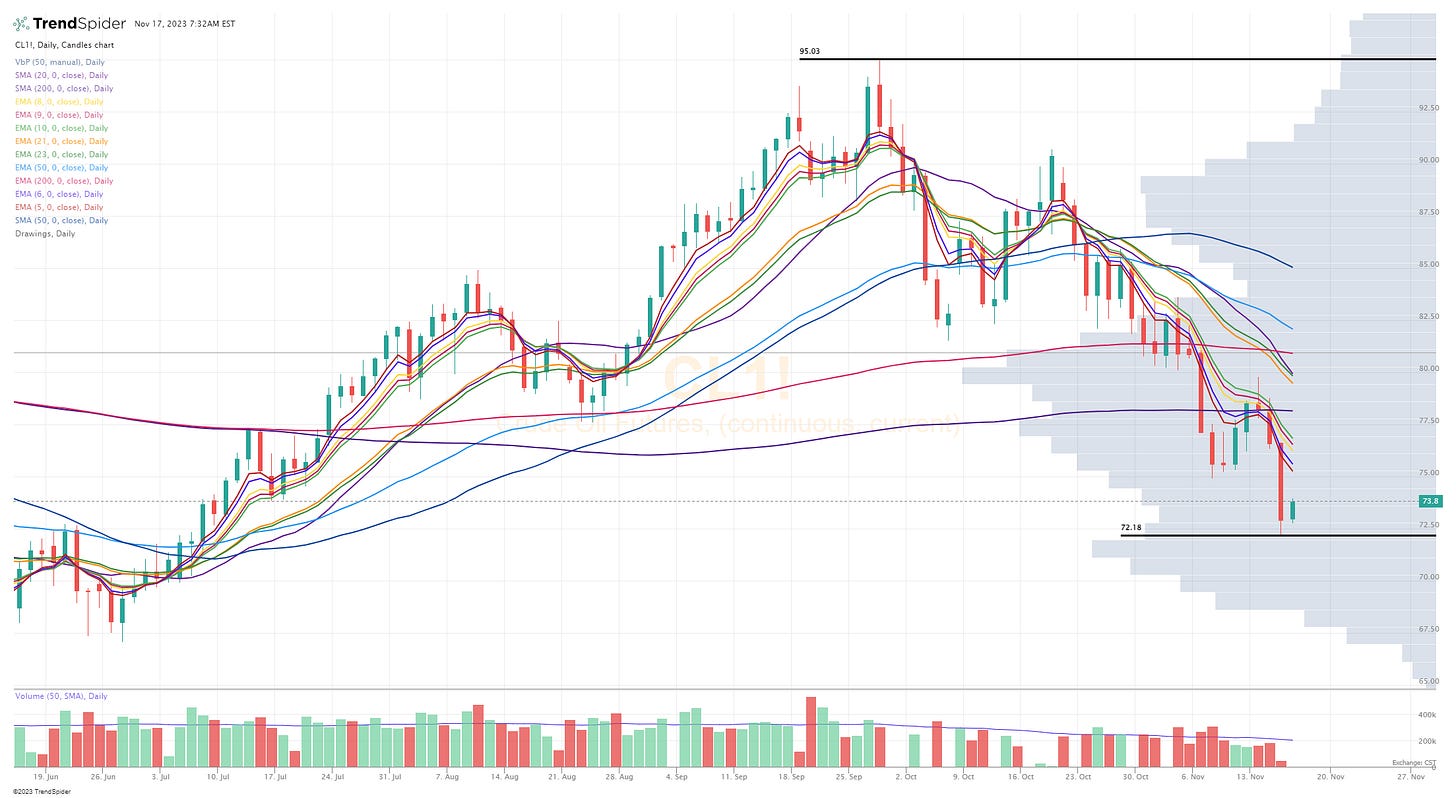
$CL1! — oil in the $70s is good for the inflation story
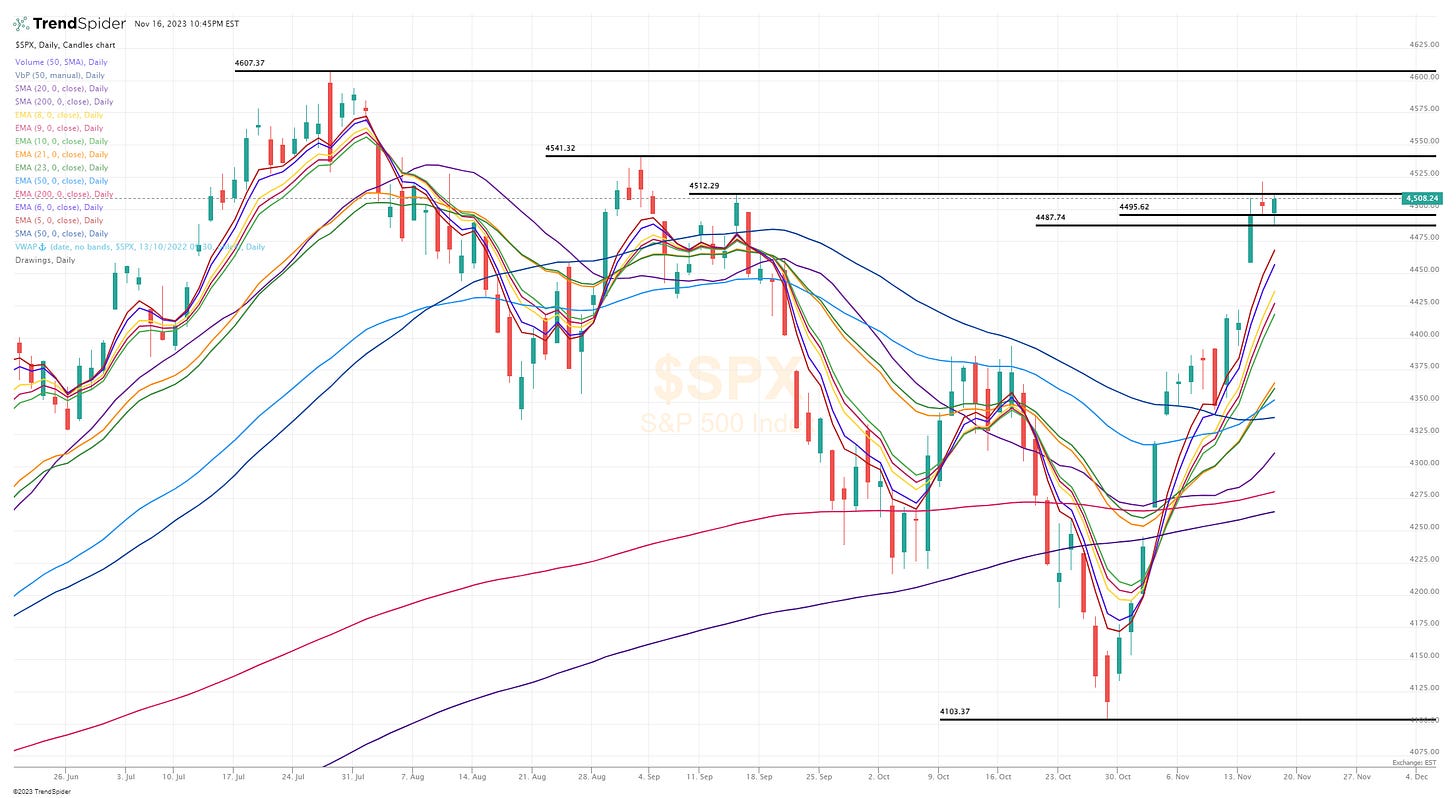
$SPX
SPY
RSP
QQQ
QQQE
IWM
IWO
ARKK
Deepvue screen #1: ACMR ACVA AER AFRM AMD AMKR ANET APG APH ARCC ARCO ASAN ATI AVDX AVGO AZTA AZUL BAC BK BKU BN BRZE CAMT CARG CCJ CCL CDNS CLS CNM COUR CRM CRWD CSTM CSX CUK CVBF CWAN CXM DASH DDOG DK DKNG DRS DT DUOL ELF ENLC ENTG EQH EXPE FAST FIVN FLEX FOUR FRO FSK FTAI GEN GFF GT GTLB H HALO HCC HLT HST IMGN IOT ITUB JPM KBH LBRT LEN LMND LNG LNW LSPD LULU LYV MA MAR MCHP MDB MFA MNDY MQ MRVL NET NFE NOW NRG NTNX NTRA NU NVT NXPI ORCL OSCR OTEX PATH PK PLTR PNC PSTG PWR RBLX RITM RMBS ROVR RPD RRC RSG RYAAY RYTM S SCS SGEN SHO SHOP SKX SMCI SNOW SNPS SO SPGI SPT STLD STNE STNG SUZ SWN TOL TRIP TS TSM TTE TTWO TWLO TWST UBER UDMY UEC UGP UPWK USB UUUU VMC VNOM VRNS VRRM VTEX WDAY WELL XP ZS ZWS
Criteria: price above $5, market cap above $1 billion, above 50d sma, above 200d sma, average volume above 400k, YoY sales growth above 20%
Below the paywall are my watchlist, daily charts and current trading portfolio including all positions (open & closed), entry prices, stop losses, YTD performance and links to my daily webcasts.


