


Trading the Charts for Thursday, November 16th

In order to read this entire newsletter you’ll need to become a paid subscriber by clicking the button below. Paid subscribers get full access to my trading portfolio (up +78.8% YTD), watchlists with charts, daily activity (buys & sells plus entry prices & stop losses, performance, etc) and my daily webcasts.
I also run a Stocktwits room where I post throughout the day about my investment portfolio (up +109.1% YTD) with full access to my holdings, performance, daily activity, market commentary, quarterly earnings analysis, daily webcasts and more.
Commentary:
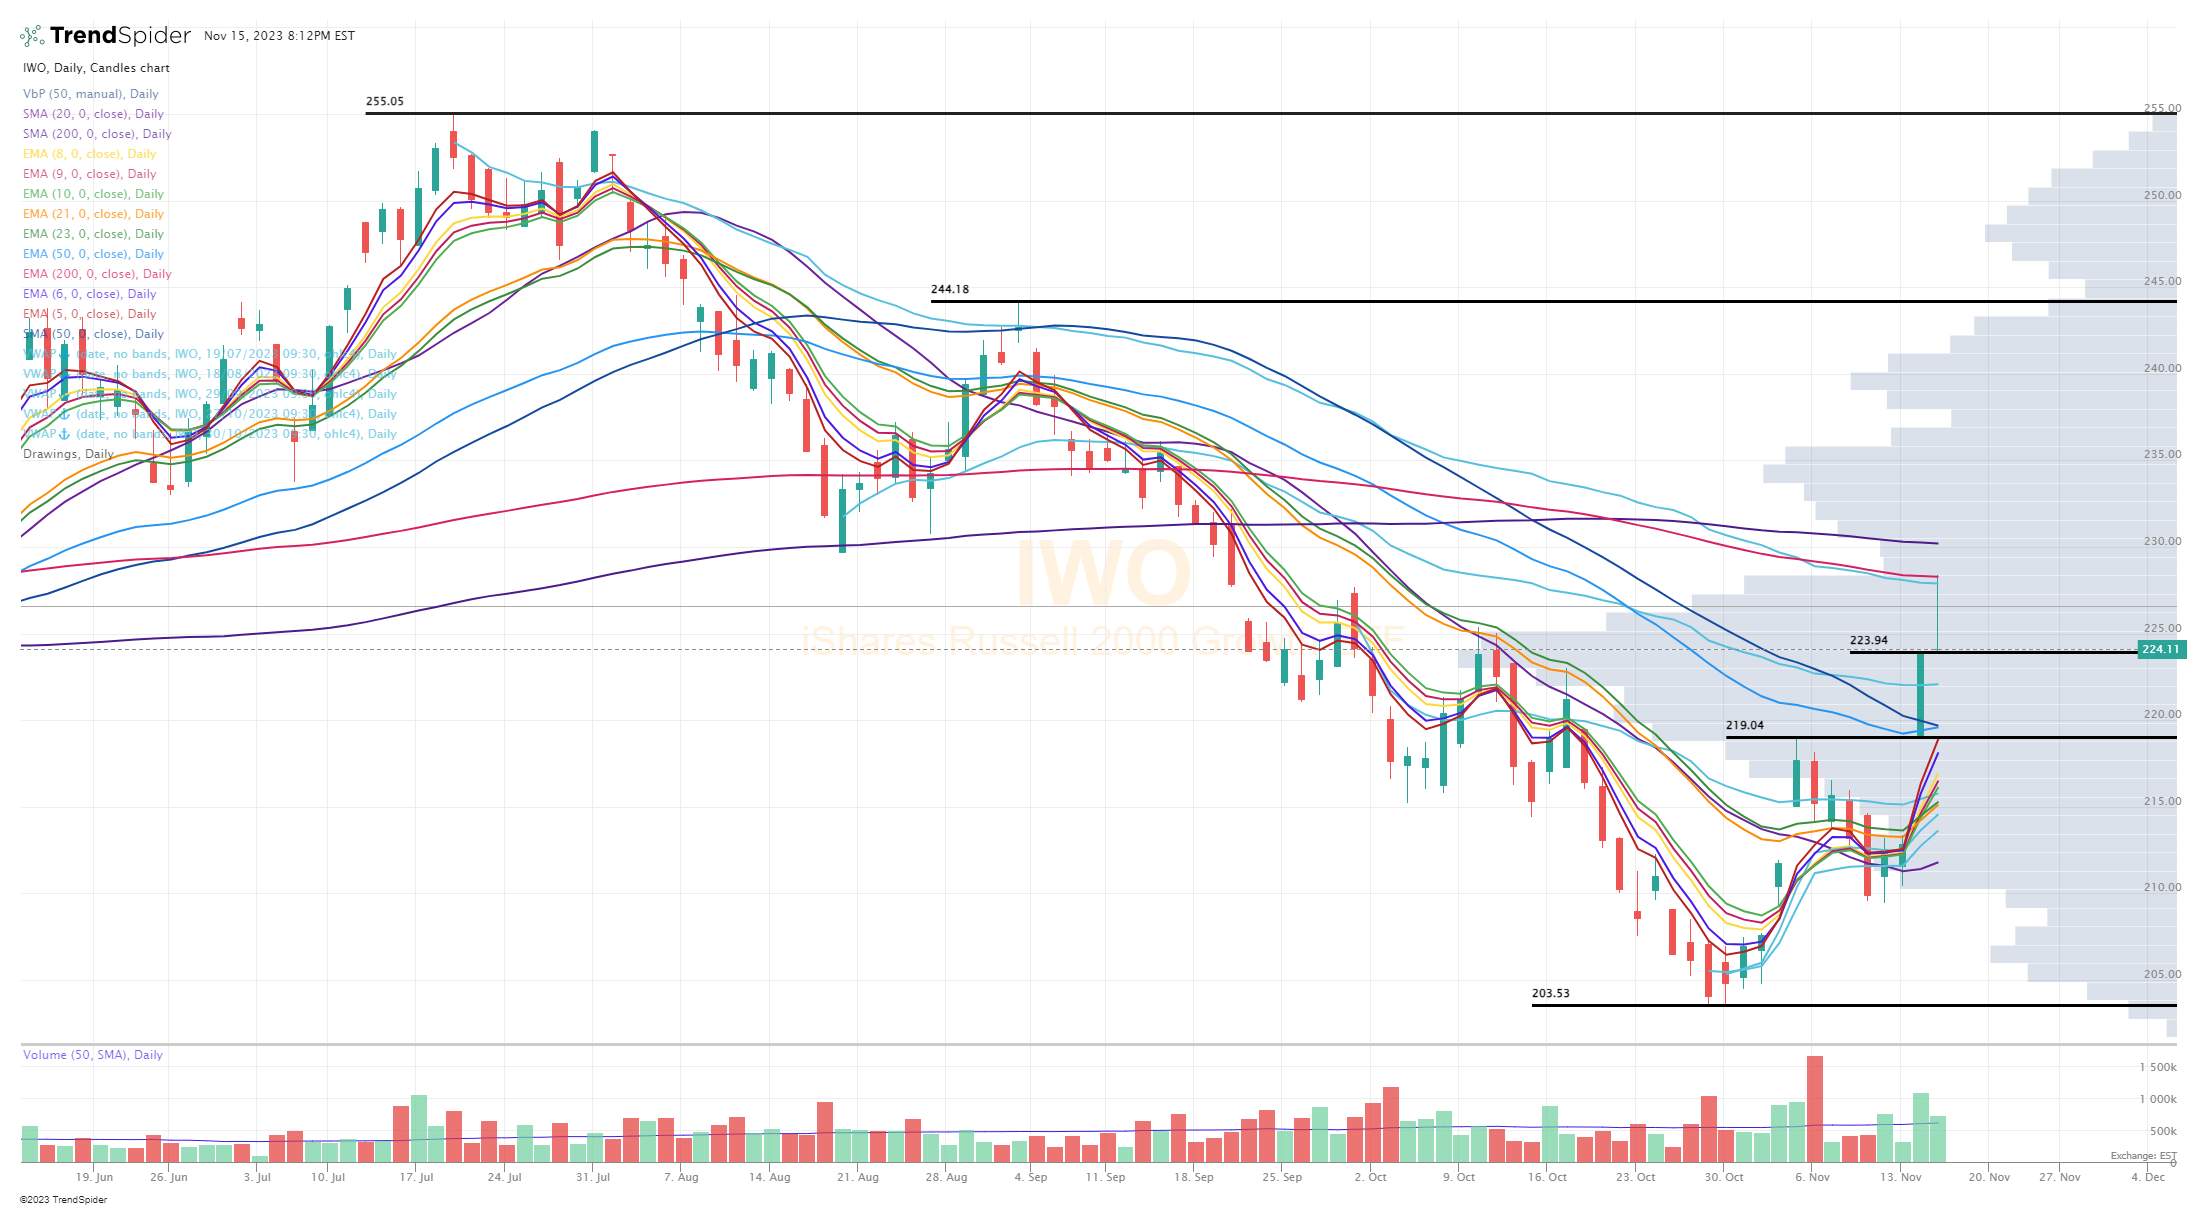
The past week has been very good for stocks however yesterday morning it was clear that the markets were running out of gas, stocks were getting overextended, and as soon as I saw the QQQ get rejected at the July highs and IWO get rejected at the 200d ema I raised up all my stop losses very aggressively to take profits on the reversals. That was definitely a good decision because we saw lots of fading into the close and then PANW and CSCO gave disappointing earnings reports after the close (down 6-10% pre-market) and WMT gave disappointing guidance this morning (down 6% premarket). I have a feeling most stocks will be in the red today which is okay, we can’t be green everyday.
Over the past week we were buying the leaders as they were breaking out on strength, now we look to buy the same leaders as they pullback on weakness. I love recycling the same ~50 stocks over and over. I’ll buy the breakouts, ride them higher, sell when they get exhausted and then buy them back as they consolidate and pullback to the 5d ema. In the meantime I will look for other breakouts if we can find any. When I’m buying at the 5d ema I’m typically putting my stop loss below the 6d ema unless all the short-term moving averages are really tight, in those cases I’ll buy at the 5/6d ema with stop loss below the 10d ema.
As always… my watchlists, daily charts and current trading portfolio are below the paywall down below… [subscribe here] to become a paid subscriber and get full a
Here are my month-to-date stats on closed positions (since November 1st):
106 trades
56.6% win rate
average winner is +4.65%
average loser is -1.9%
fwiw, if I was able to average these stats over the course of an entire year, with 6 trades per day and average exit position of 5.5%, then I’d be up approximately ~134% for the entire year. Just goes to show you don’t need to average 10% on every winning trade to have monster years, you obviously need a decent market but you can still put up big returns but finding the leaders and riding them hard when things are working while being very disciplined with your risk management. Of course my goal is always triple digits which is why I’m always trying to refine my strategy and adapt to changing market conditions.
Here are my deep dive newsletters…

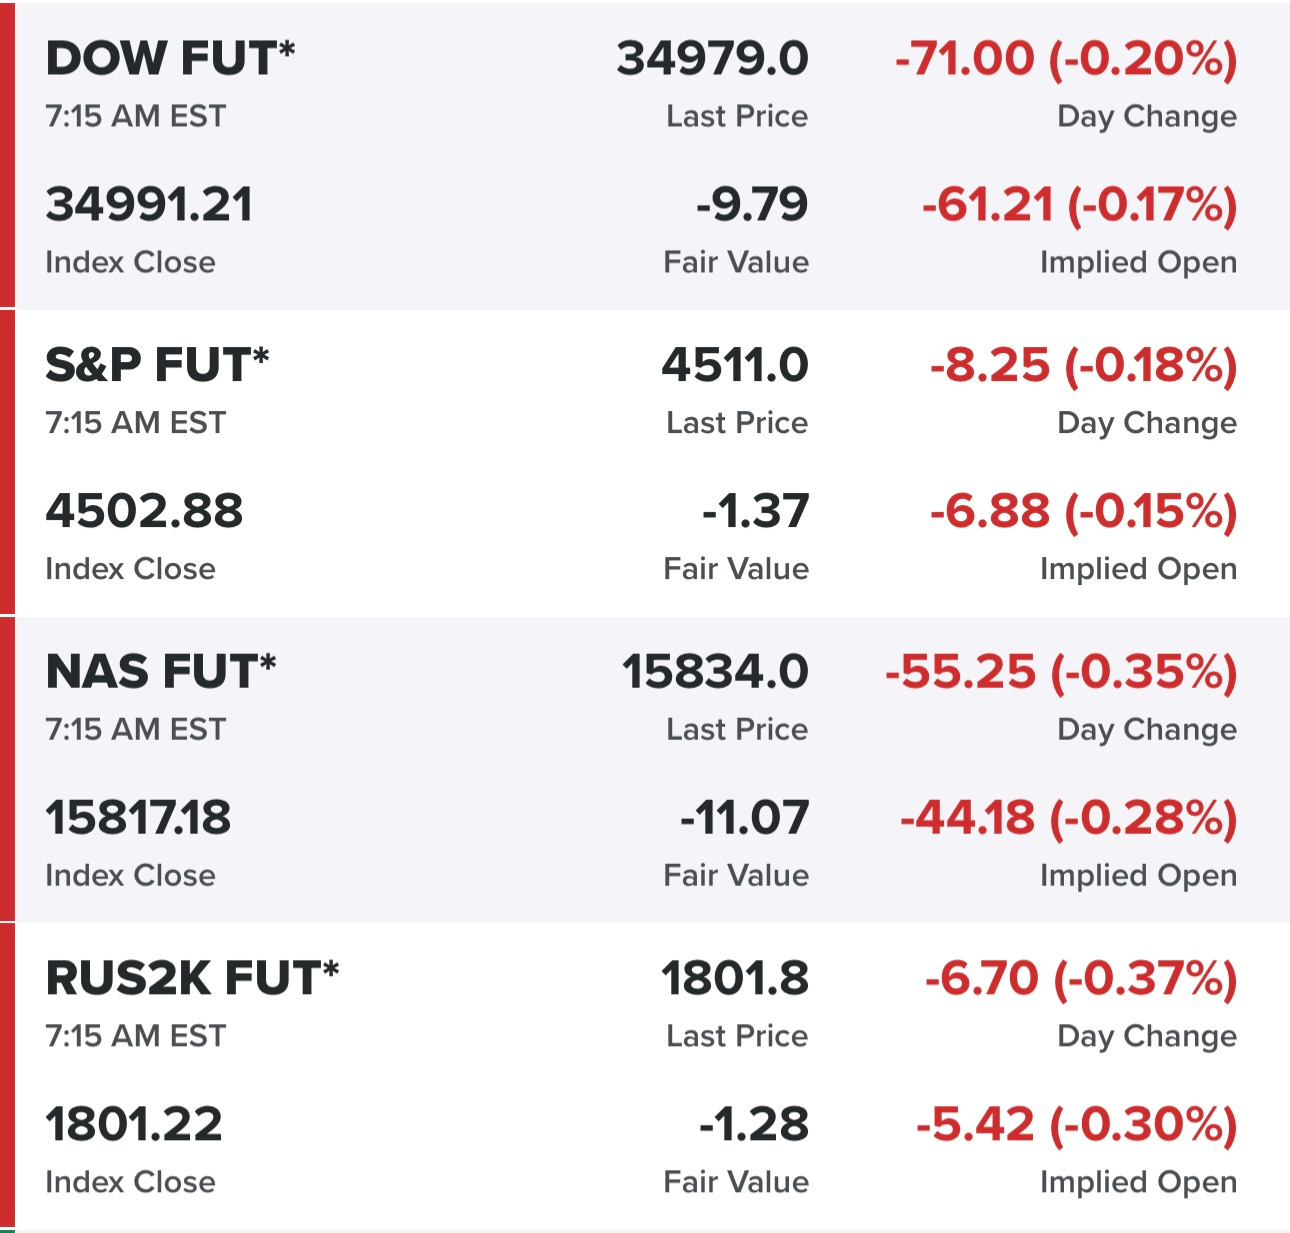
Equity futures…
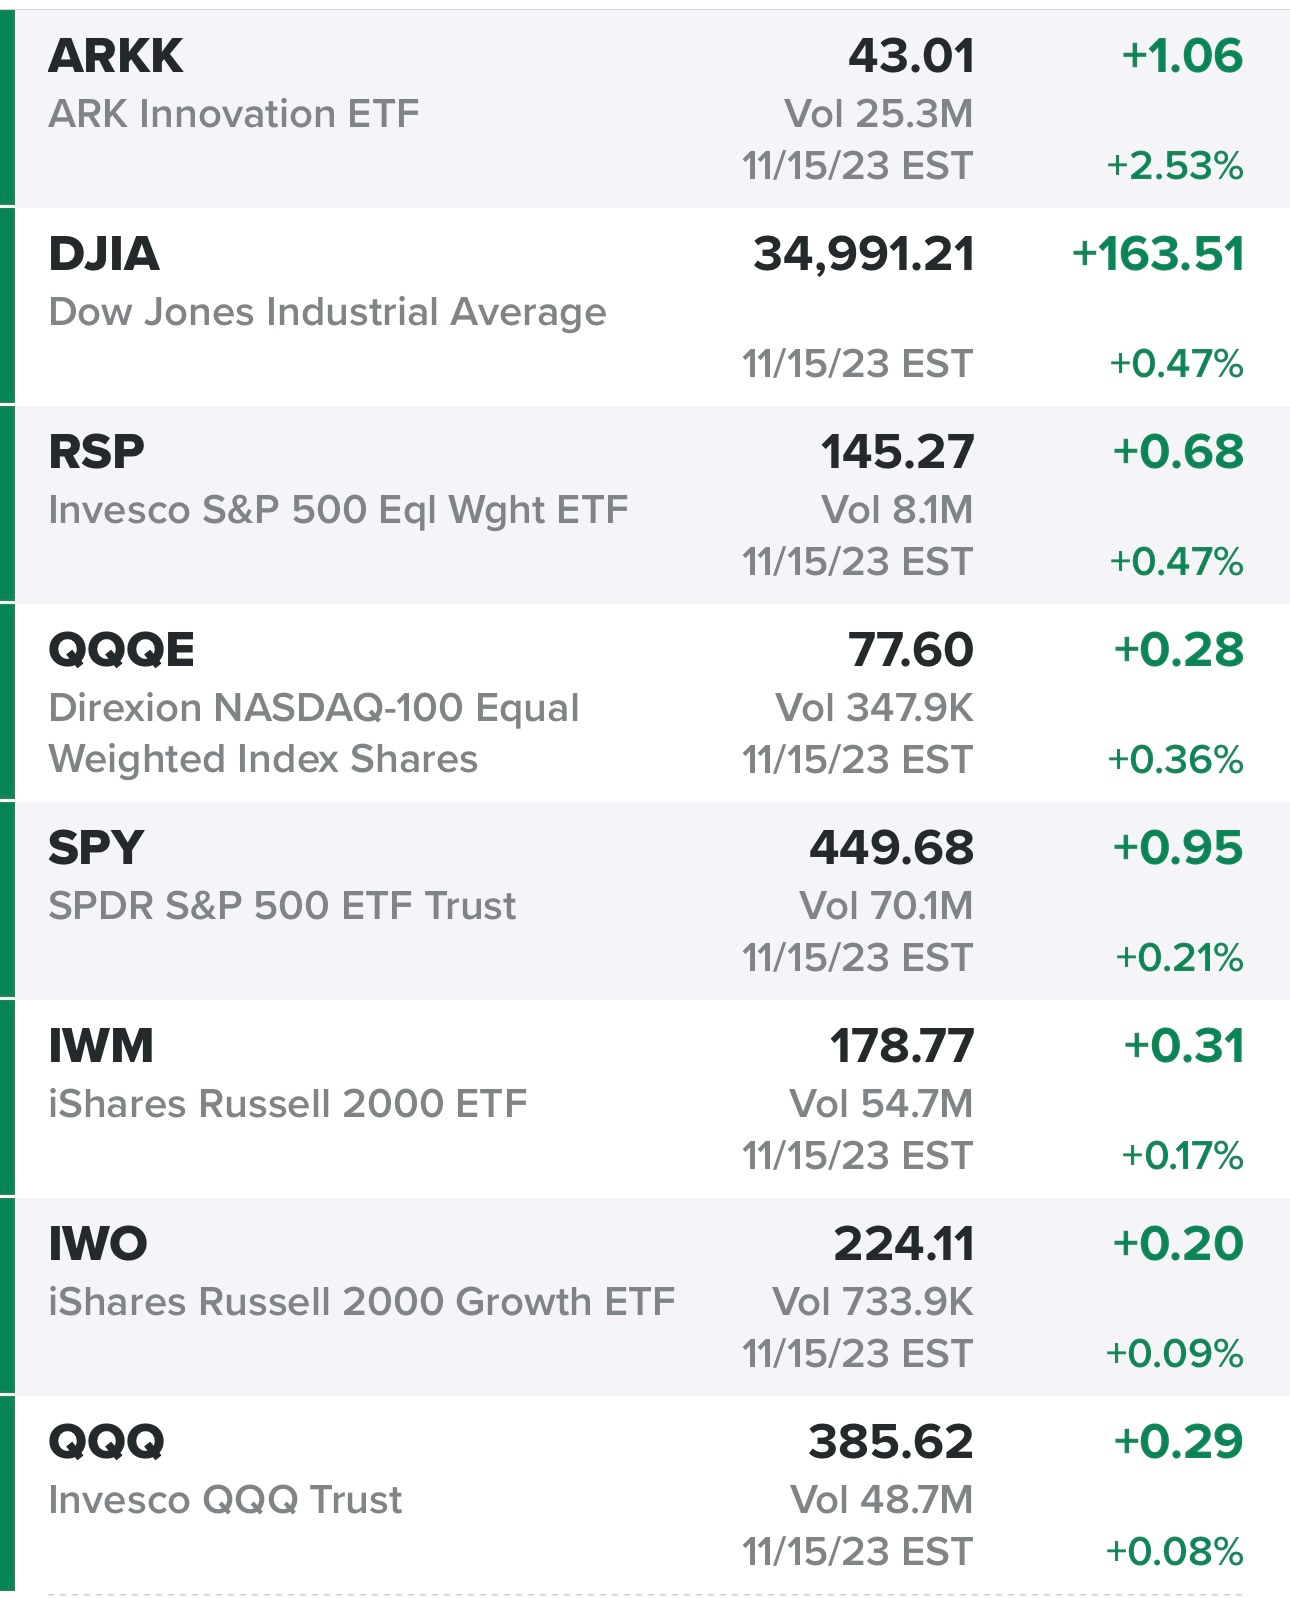
Indexes from yesterday…
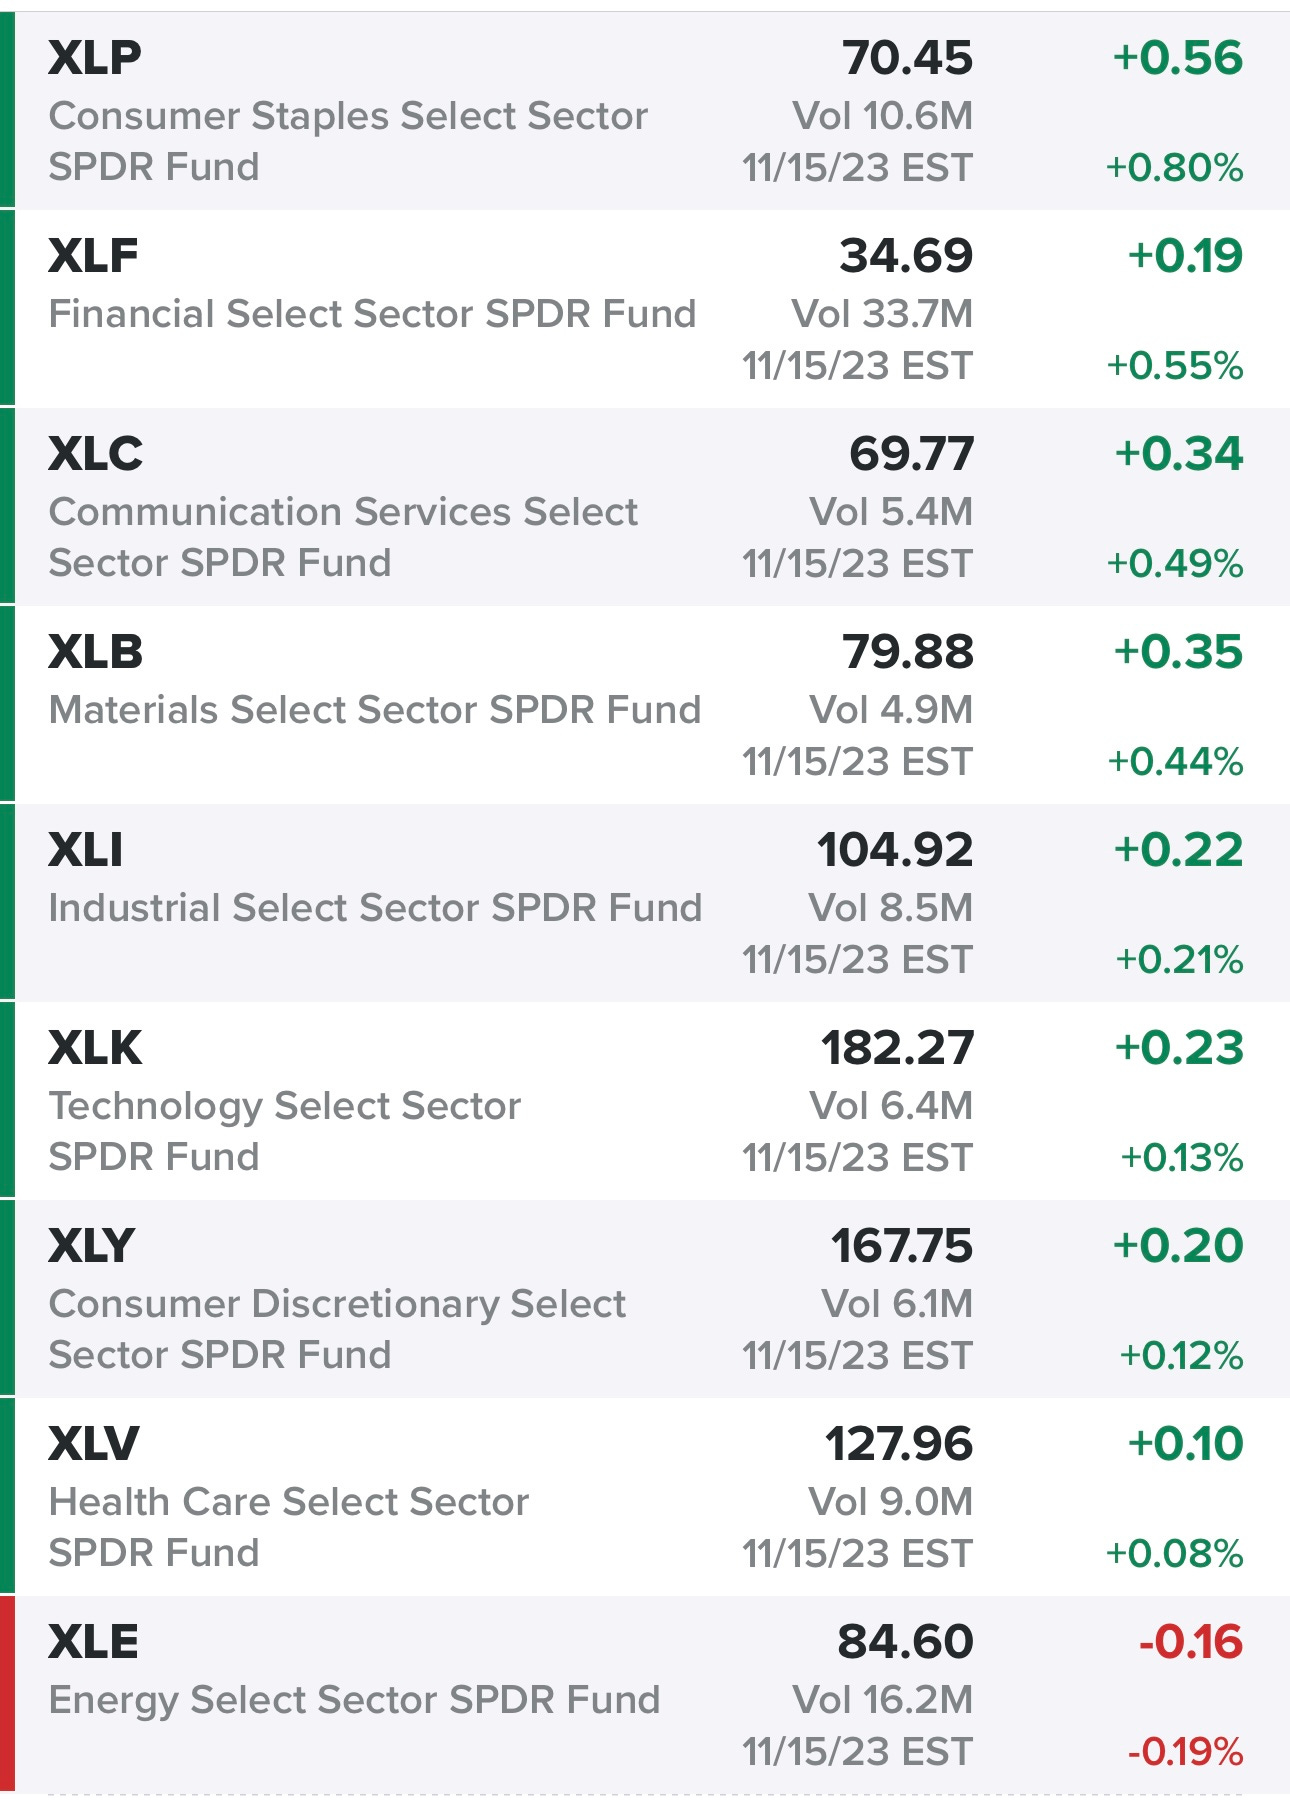
Sectors from yesterday…
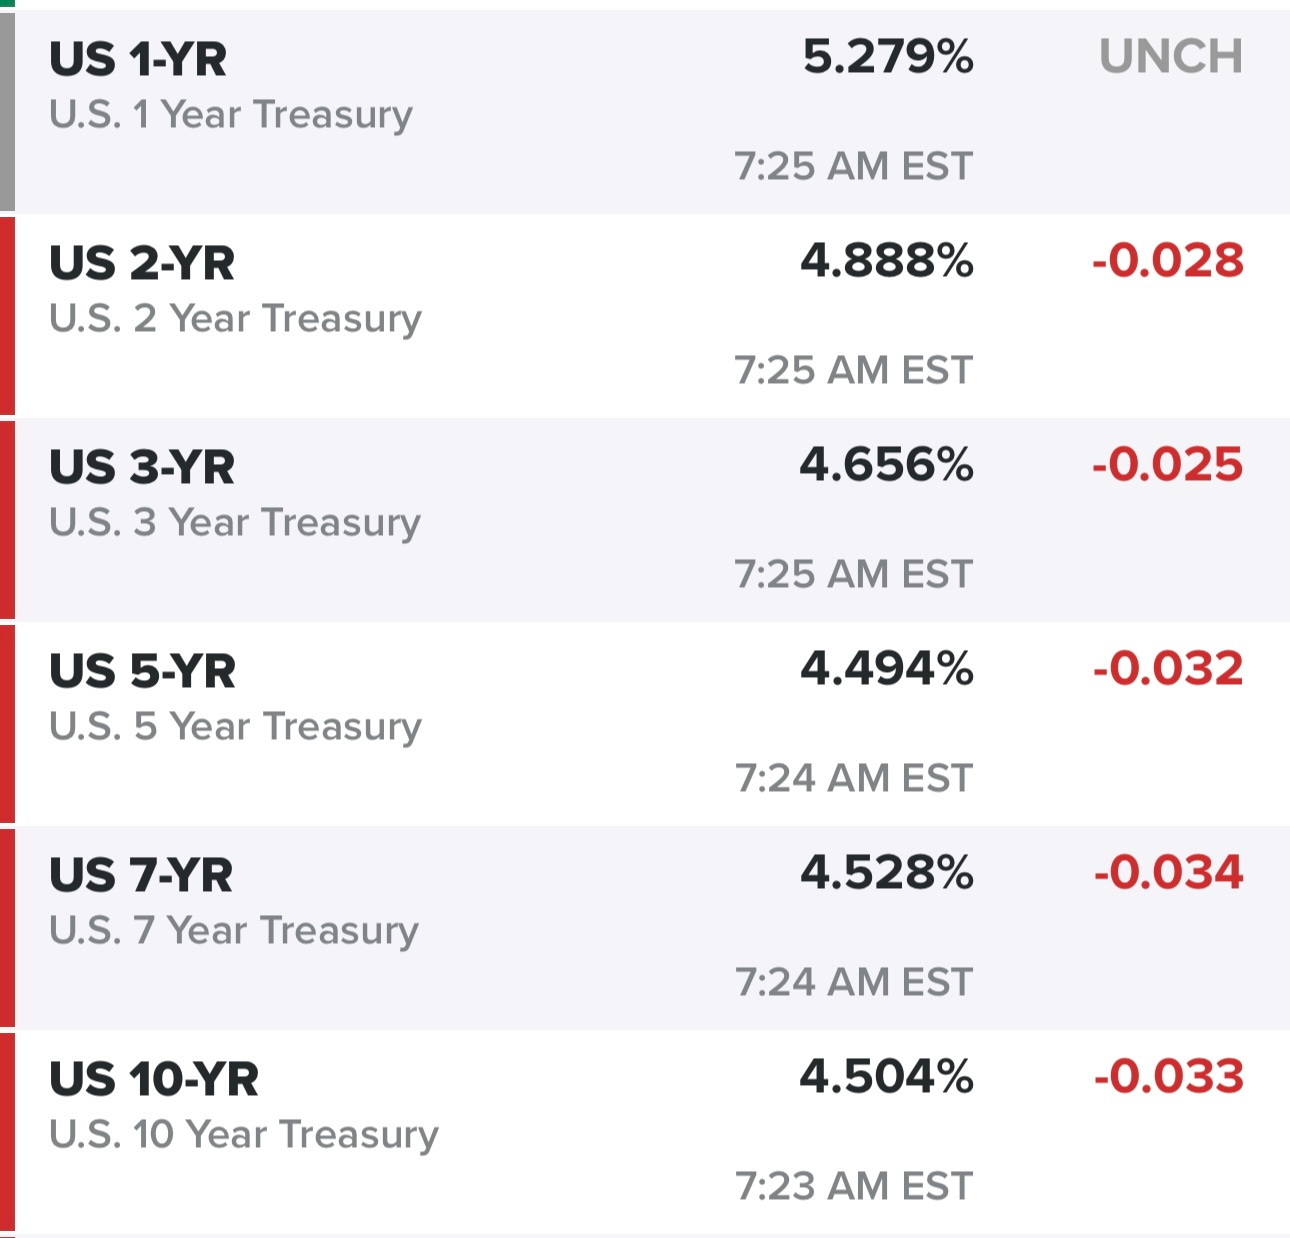
Rates…
New highs vs new lows…

Market performance…

$TNX

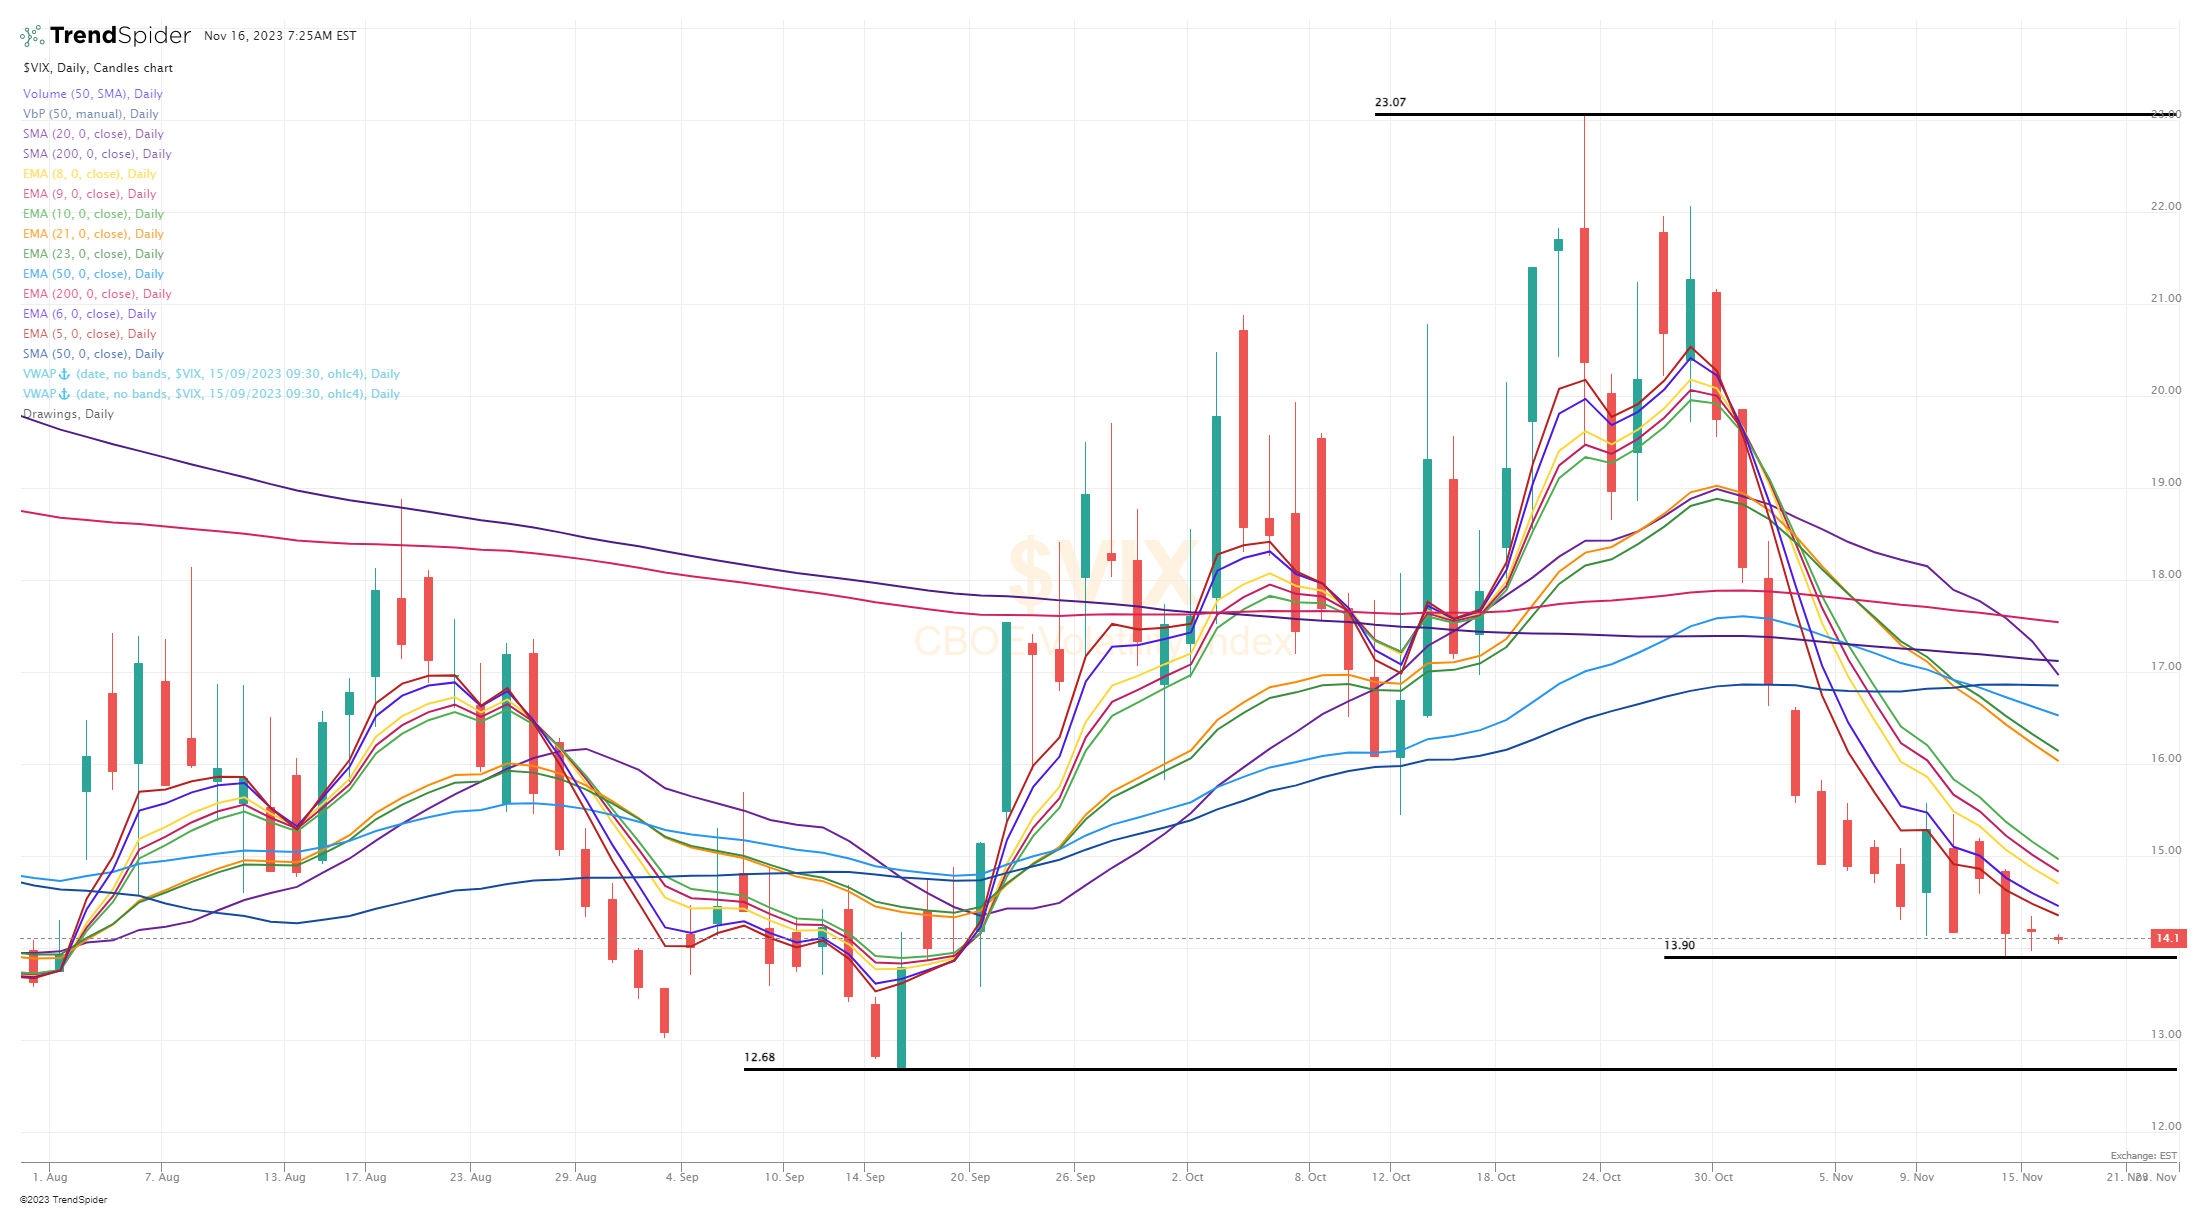
$VIX
$CL1!

$SPX

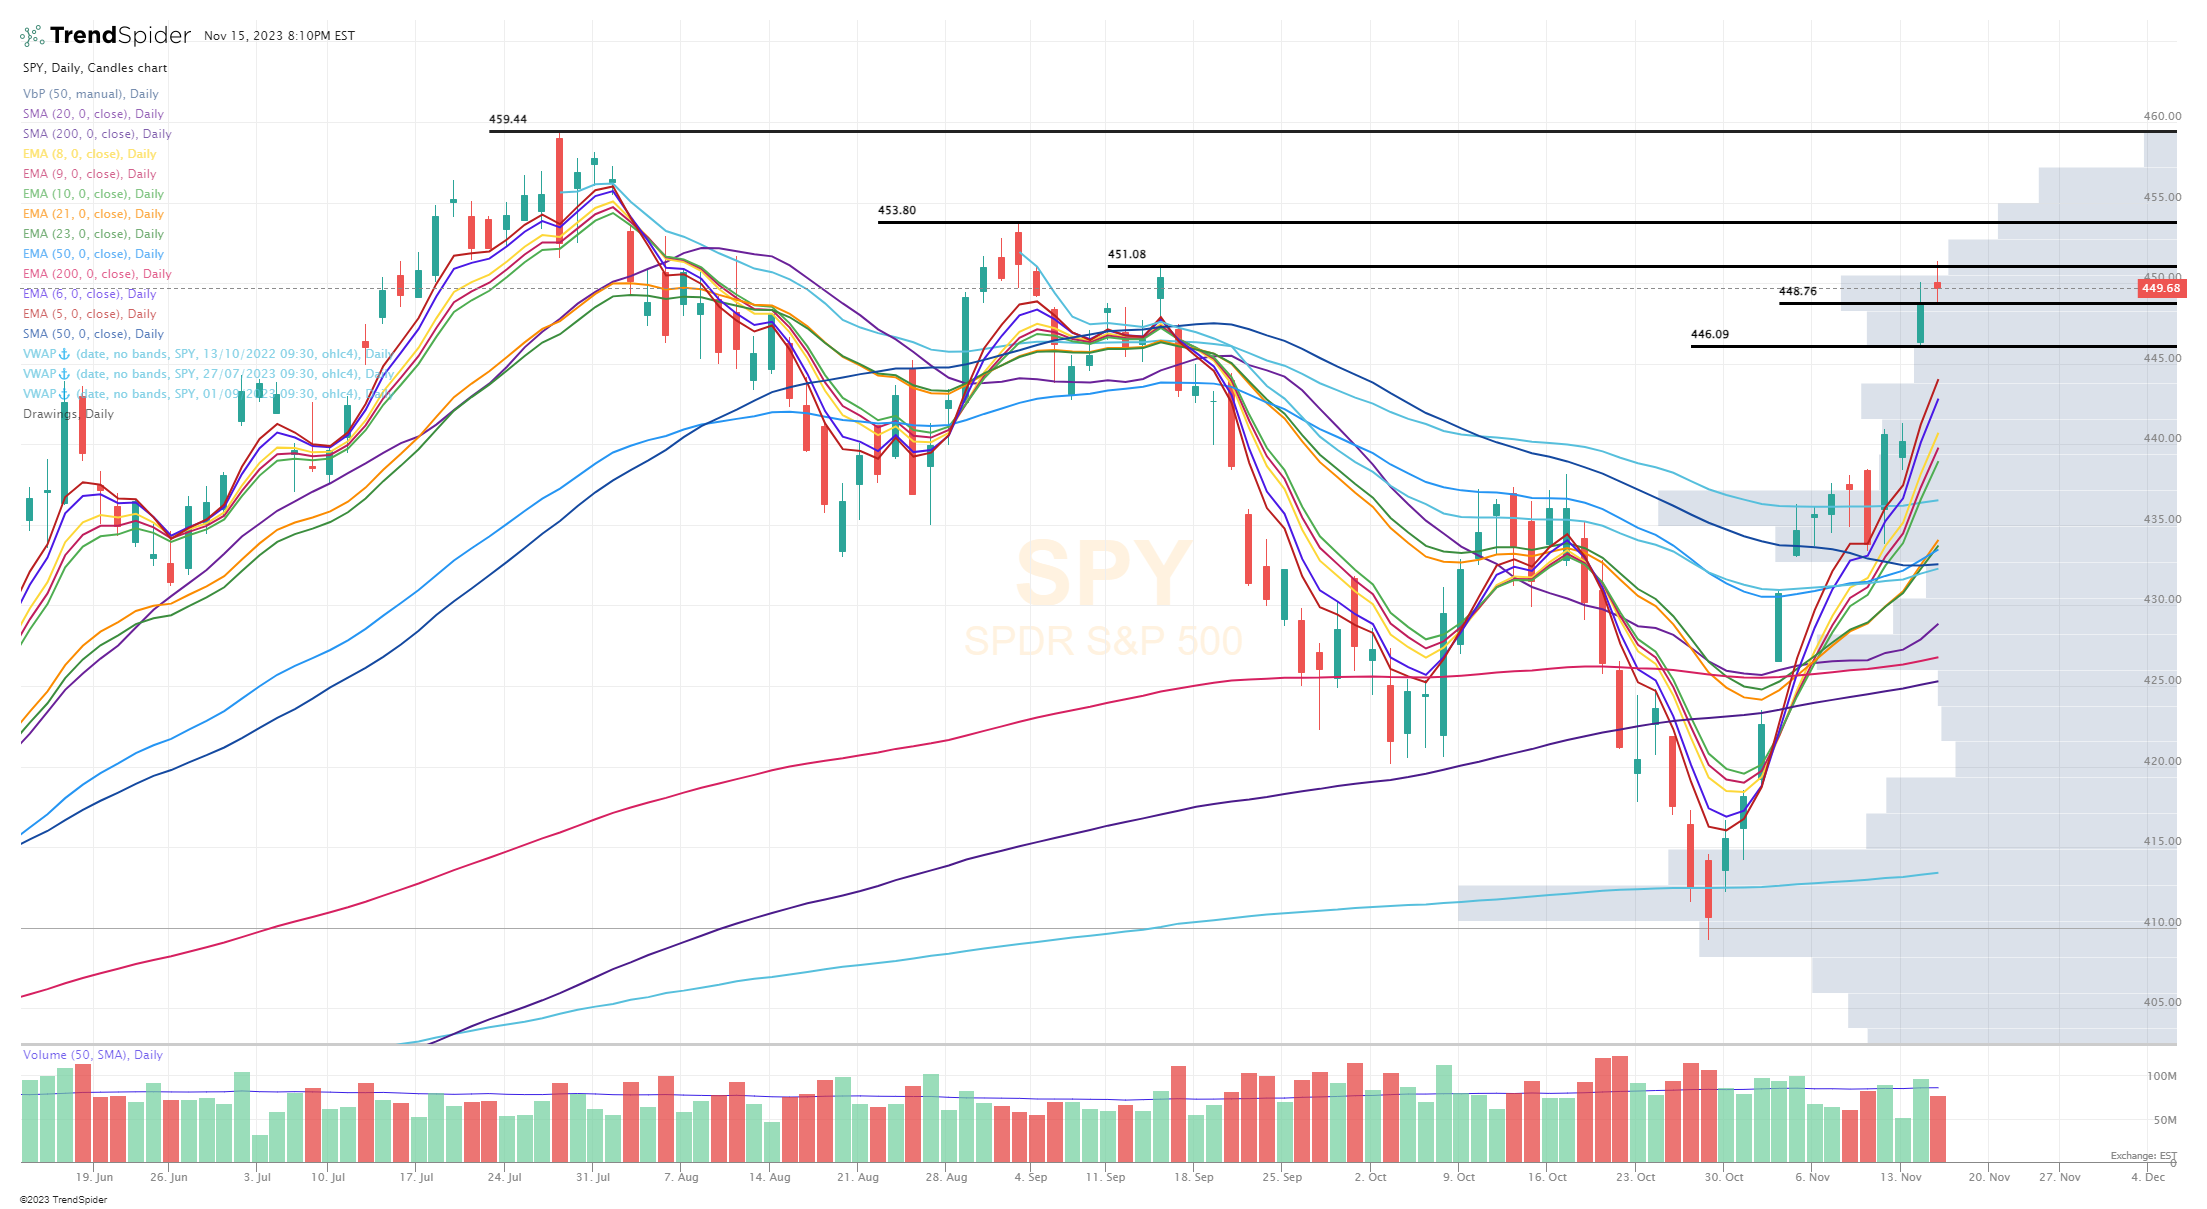
SPY
RSP

QQQ

QQQE

IWM

IWO
ARKK

Deepvue screen #1: ABNB ACMR AER AMD ANET APG ARCO ASAN ATI AVDX AVGO AVPT AXNX AZUL BAC BK BN CADE CALM CARG CCJ CCL CDAY CLS CMRE CNM CNQ COUR CRNX CRWD CUK CVBF CWAN CXM DASH DDOG DHT DK DKNG DRH DT DUOL DV ELF ENTG EQH EURN EXPE FMX FNB FOUR FRO FROG FSK FTAI GFF GTLB H HALO HLT HST HUBS ICLR IDYA IMGN INSW IOT ITCI ITUB JBI JPM JXN KBH LADR LBRT LEN LMND LNG LPG LSPD LULU LYFT LYV MAR MCHP MDB MNDY MPC MPWR MQ MRVL NCNO NET NFE NOW NTRA NU OKE OSCR OTEX OWL PANW PARR PK PLAY PLTR PSTG PWR RCL RITM RMBS ROVR RRC RYTM S SFL SHEL SHO SHOP SMCI SNOW SNPS SPGI SPLK SPT STLD STNE STNG STWD SUZ SWN TRGP TRIP TS TSLA TSM TTE TTWO TWLO TWO TWST UBER UDMY UEC UPWK UUUU VCYT VMC VNOM VRNS VRRM WDAY WELL ZS ZWS
Criteria: price above $5, market cap above $1 billion, above 50d sma, above 200d sma, average volume above 400k, YoY sales growth above 20%
Finviz screen #1: ACGL ACMR AFRM ANET APP ARCC ASAN ASML AXNX AZTA AZUL BAC BBIO BIRK BK BKU BRBR BRZE CCJ CCL CEIX CIEN COUR CRWD CUK CWAN DASH DB DBRG DDOG DHT DKNG DT DUOL DV ELF EQH ERJ EURN FLS FOUR FRO FROG FRPT FTAI FULT GEN GTLB HUBS HWC IMGN IOT ITCI JPM KEY KKR KNF KTOS LLY LMND LPG LSPD LYV MDB META MMYT MNDY MRTX NAVI NET NOW NTNX NTRA NU NVDA NVO NXT OSCR OSK OTEX PANW PARR PNC PWR RBLX RCL RITM ROVR RYTM S SFL SHOP SN SNOW SPT STNE STWD SYM TREX TWO UBS UEC URI USB UUUU VOYA VTEX WAB WFC WING XP ZION ZS
Criteria: price above $5, market cap above $1B, above 50d sma, above 200d sma, average volume above 400k, QoQ sales growth above 15%
Below the paywall are my watchlist, daily charts and current trading portfolio including all positions (open & closed), entry prices, stop losses, YTD performance and links to my daily webcasts.