Trading the Charts for Monday, June 26th
I also run a Stocktwits room where I’m active throughout the day but mainly post about my investment portfolio which is currently up ~76% YTD thanks to huge gains with CELH, LNTH, UBER, MELI, SDGR, ONON, TSLA, GLBE, SWAV, XPOF, NU, FLNC, CFLT, DOCN and several others. You can join by clicking the button below:
Here are my other newsletters…
Good morning and Happy Monday,
Hope everyone had a nice weekend, we’re coming into a light week for macro and earnings with durable goods, Case Shiller and new home sales on Tuesday, Powell speaking on Wednesday/Thursday, jobless claims on Thursday and PCE on Friday.
In my investment portfolio I’m always 40% hedged overnight to protect against any nasty gap downs, but if my shorts (ARKK, IWM, IWO) look like they are bottoming the next day I’ll cover in which case I’m unhedged (max long) for any bounce but I’ll put those shorts back on if the lows of the day don’t hold. This strategy has been working pretty well the past few weeks so I’ll stick with it for now.
In my trading portfolio I’ve pivoted from buying breakouts to buying pullbacks because that’s what the market is giving me right now… I’m fine with both strategies as long as I can keep my max risk below 3% going into every trade although my average loss YTD is just 2% on my losers versus 8% on my winners. We’re not seeing many breakouts right now which means if that’s your focus you need to adjust or just stay on the sidelines. Personally I love buying the market leaders (strong fundamentals, institutional accumulation, good relative strength) as they pullback to their 10d, 20d, 50d moving averages. If they bounce, I’m hoping to ride them for 20-30% over the next 3-6 weeks. If they slice through, I’m getting stopped out with a 1-3% loss.
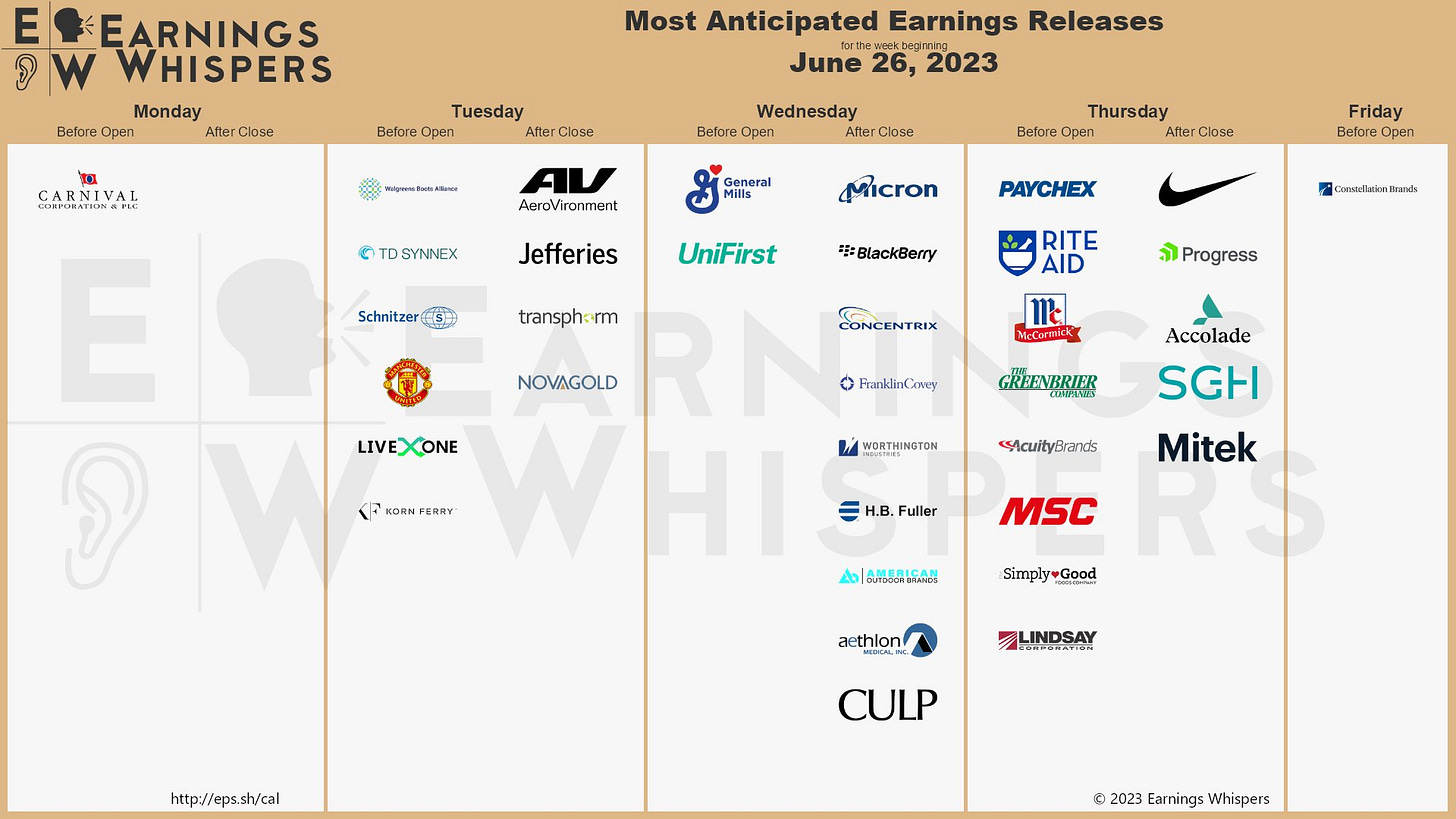
Here are earnings reports for this week…
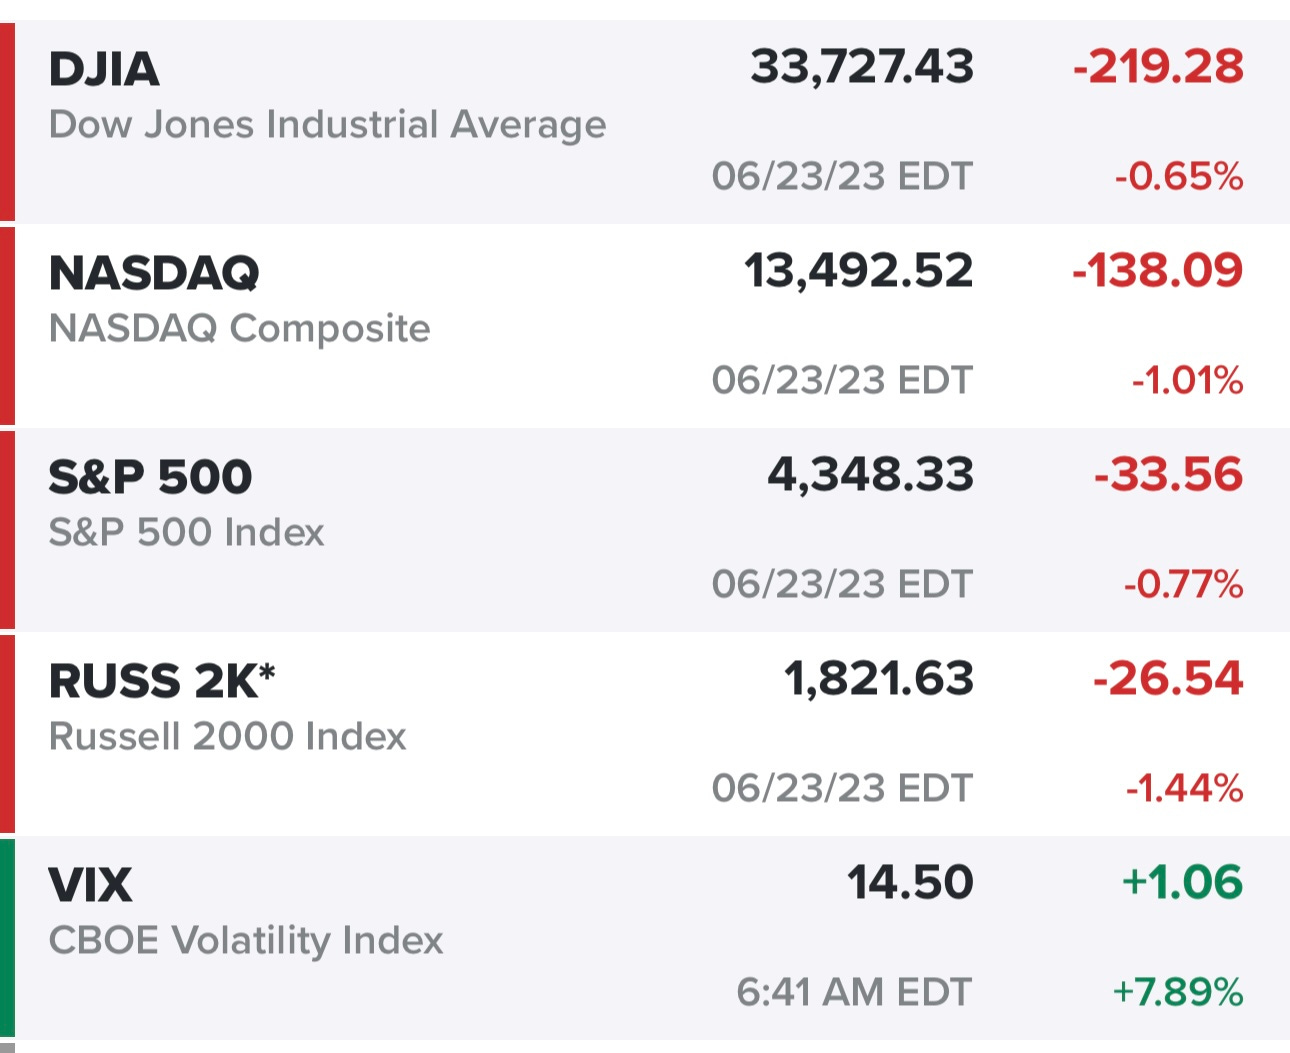
We’re coming off a red session for the indexes with small/mid caps getting hit the hardest…
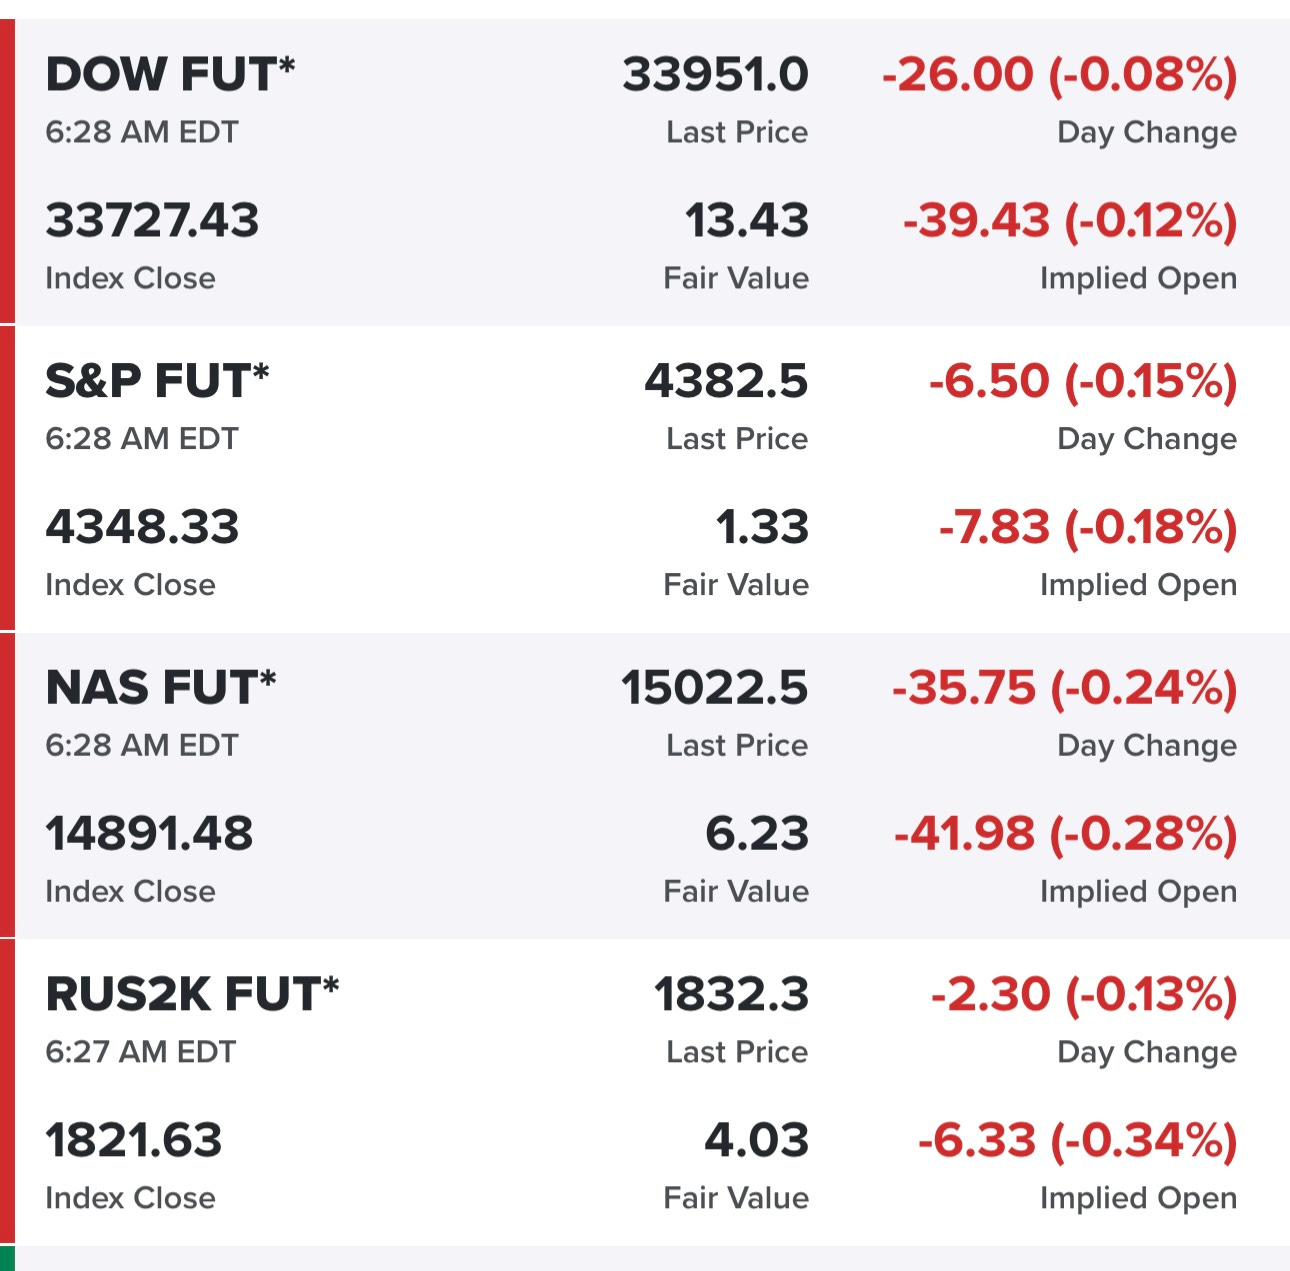
Futures down slightly this morning…
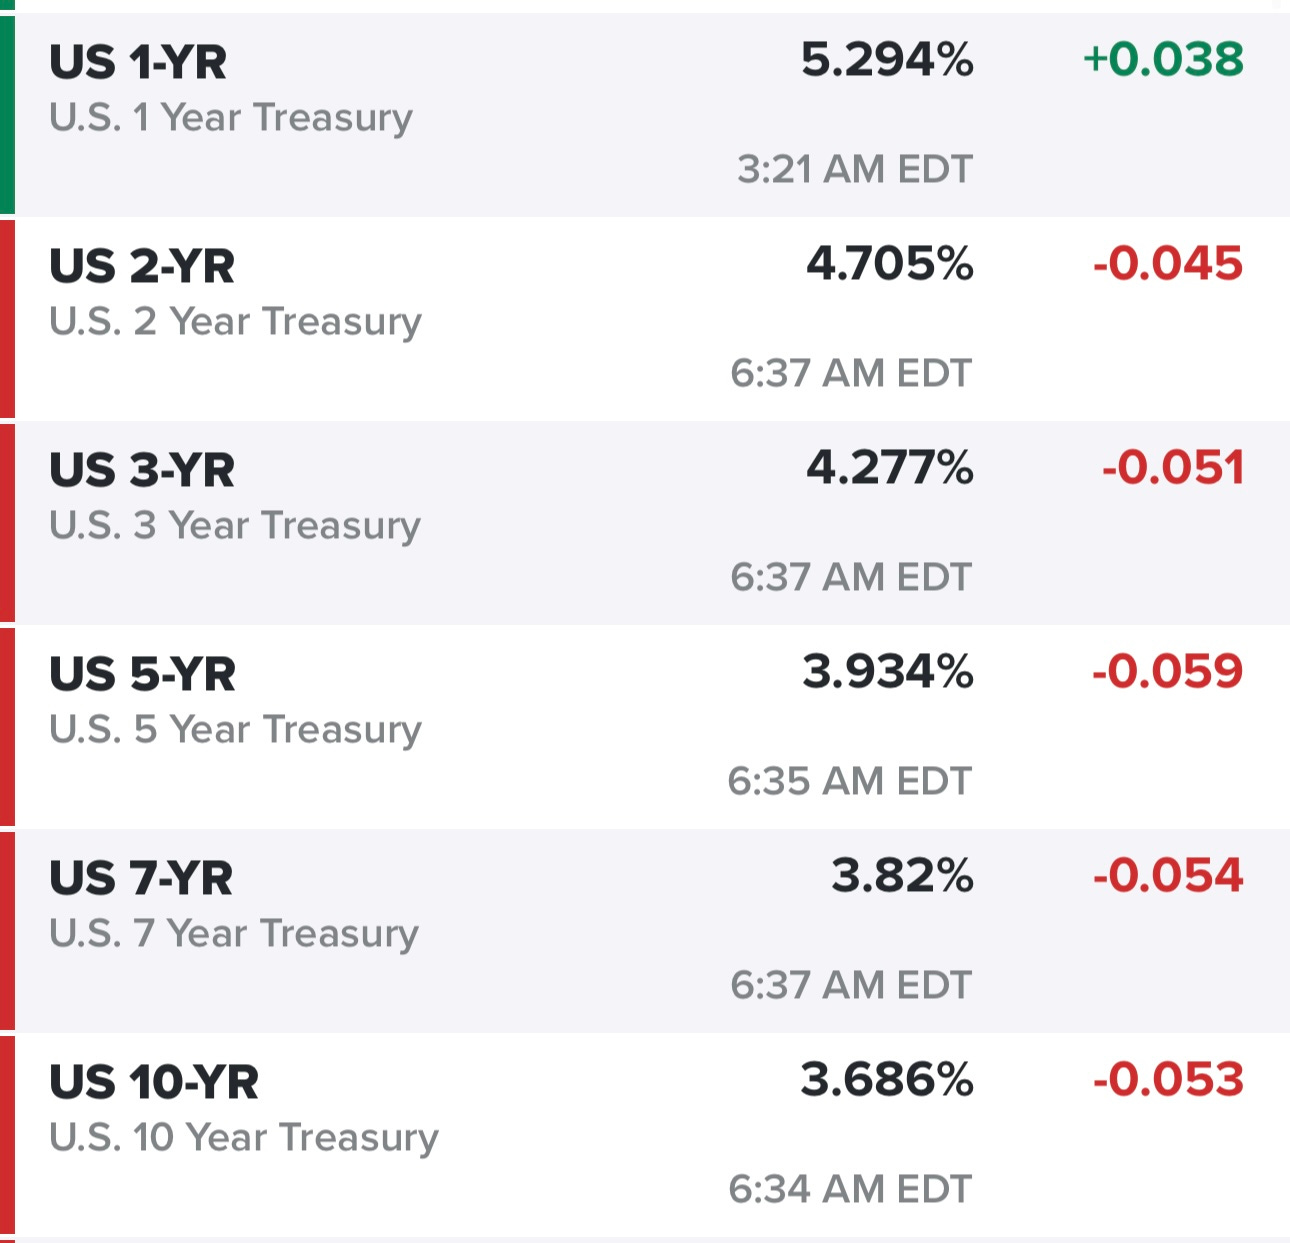
Yields down this morning….
Oil still below $70 per barrel…
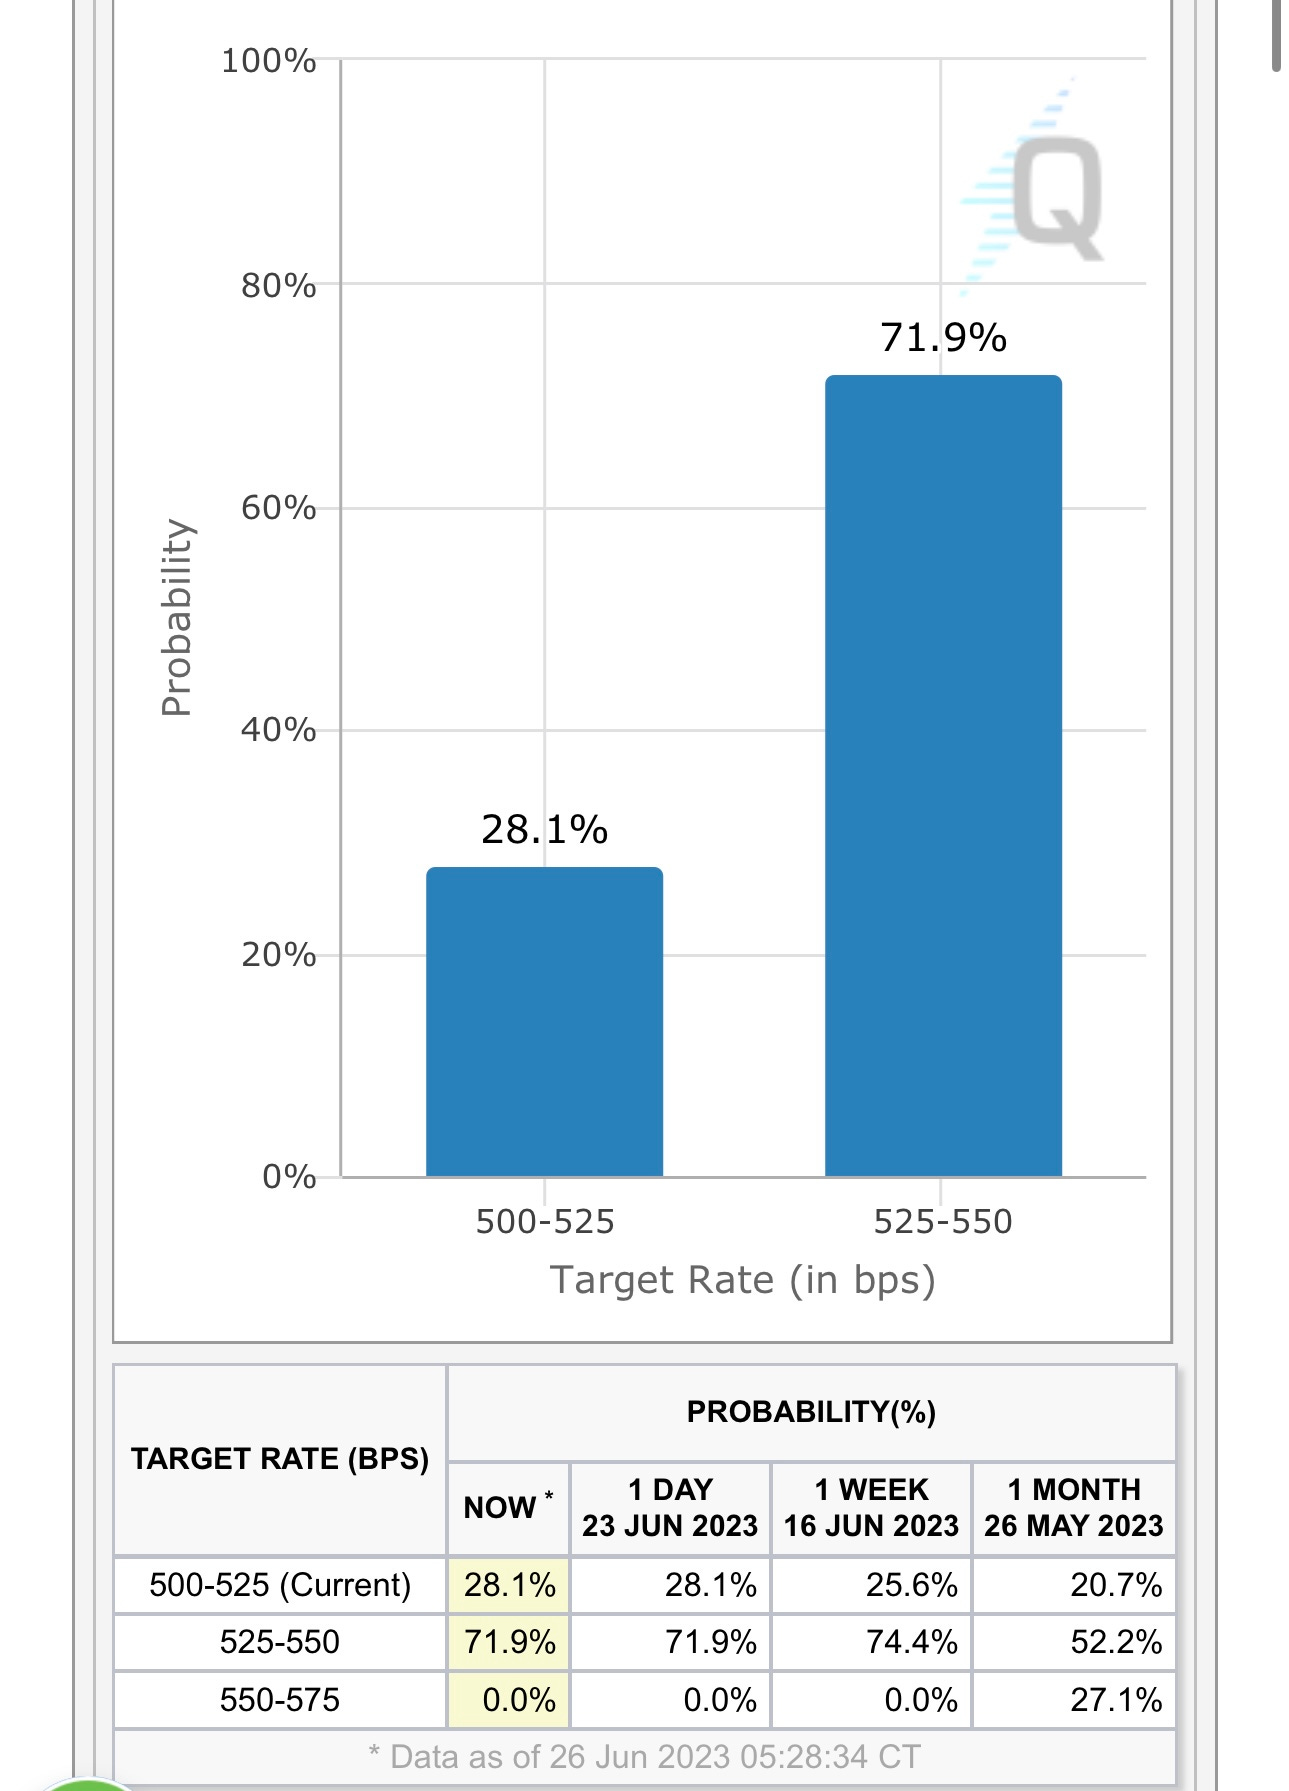
Chances of a 25 bps rate hike at the July FOMC meeting is coming down but still above 70%…
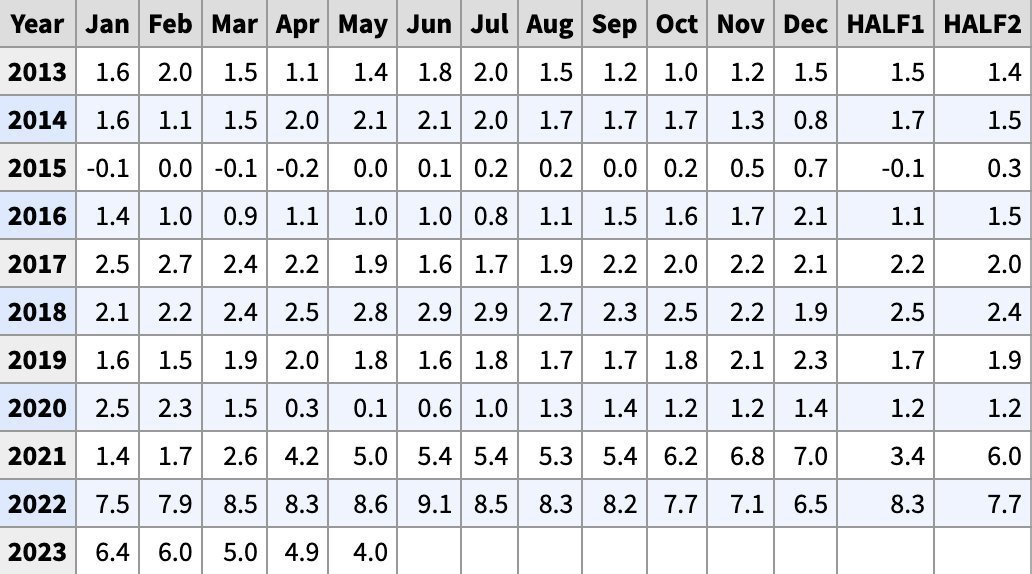
Here are the YoY inflation rates (by month) for the past 10 years, we’re not at 4.0% YoY for headline CPI and should see a number on July 12th of 3.0% to 3.4%
SPY was down on Friday but did bounce off the VWAP from the June 1st big green candle, next area of support should be the 431 pivot line and then below that it’s the rising 20d sma.
RSP down -3.5% since that recent high on June 16th, Friday it bounced off the 20d sma after failing to hold the VWAP from the May 31st recent low. Just below the current candle is the 50d ema and 200d ema.
QQQ failing to hold the 10d ema on Friday but finding support at VWAP from June 2nd gap up, the 20d sma is 1.4% below Friday’s closing price.
QQQE looking more like RSP, the equal weighted indexes are pulling back harder than the market cap weighted indexes. RSP bounced off the 20d sma whereas QQQE is trying to bounce off the 23d ema after blowing through the 20d sma on Friday.
IWM also pulling back hard, now only up +3.56% for the year which trails the SPY at +13.3% and QQQ at +36.2 — IWM did find support on Friday at the 50d ema. If we bounce off the 50d ema again today I’ll probably buy some TNA for a trade however if we blow through the 50d ema I’ll probably get short IWM or buy some TZA as a hedge.
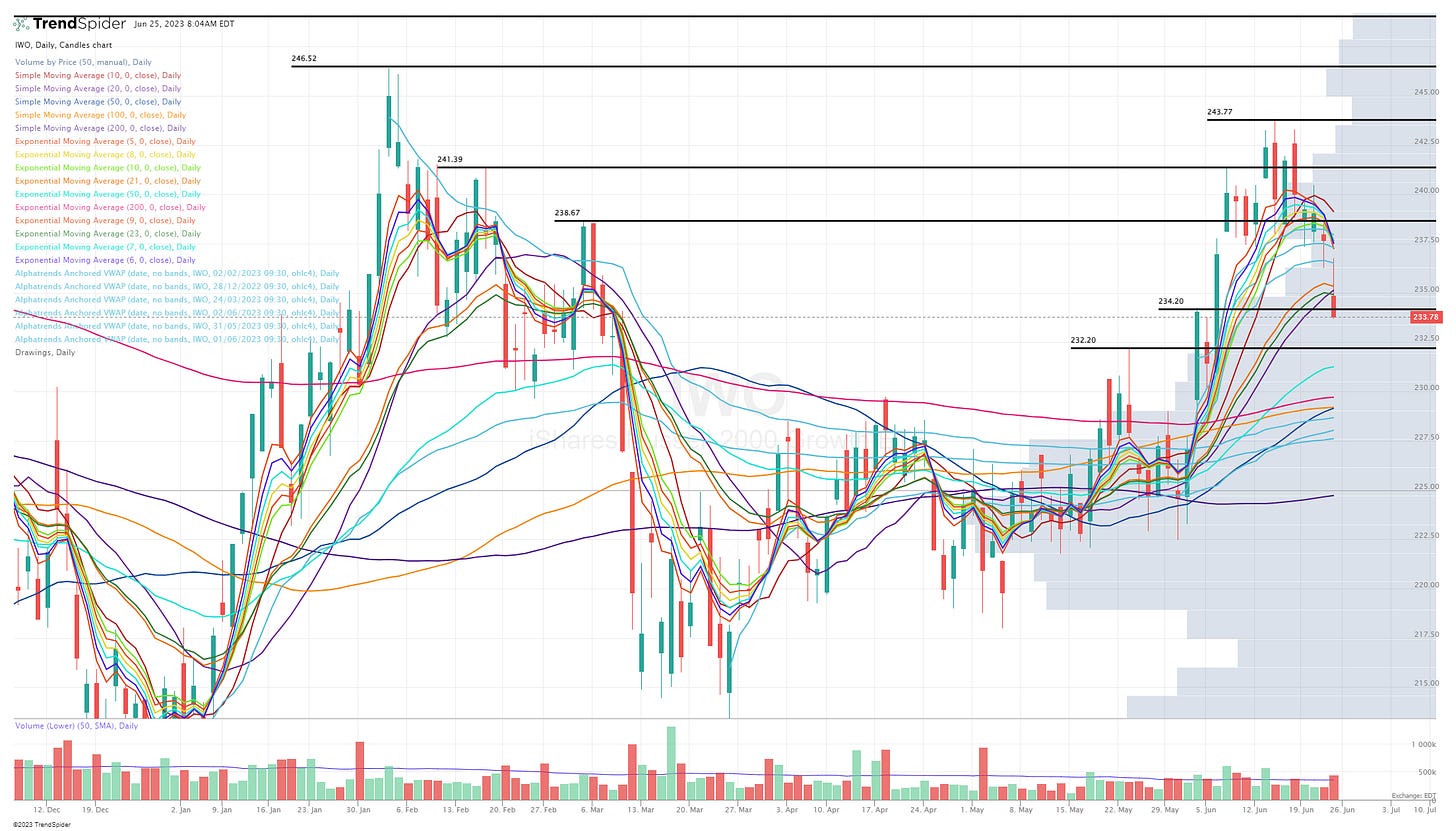
IWO looking pretty ugly the past week after rolling over from the recent highs, failing to hold the 21/23d ema on Friday. Of course there are some VWAPs just below the current price but not sure if any of them matter compared to the 50d ema which is at 231.25 or 1% below the current price.
ARKK looking similar to IWO, down -6.8% in the past 5 trading days, sliced right through the 200d ema and then the 21/23d ema, there are some VWAPs below but impossible to know if any of them hold, 50d ema is at 40.55 which is 3.3% below Friday’s closing price. I came into today 40% hedged with my ARKK short so I’ll look to cover today at the lows if it starts to bounce but then I’ll put the short back on if we start making new lows for the day.
Below the paywall is my current trading portfolio and watchlist with charts, entry points, stop losses, etc. (PS: my investment portfolio is different and only available to my Stocktwits subscribers and my Substack deep dive subscribers)
Please note that I have changed the links/URLs for my webcasts as well as my portfolio spreadsheet — I have to do this at the beginning of every month so former subscribers no longer have access to the content that is exclusive for paid subscribers.


