


Trading the Charts for Friday, June 23rd

I also run a Stocktwits room where I’m active throughout the day but mainly post about my investment portfolio which is currently up ~77.8% YTD thanks to huge gains with CELH, LNTH, UBER, MELI, SDGR, ONON, TSLA, GLBE, SWAV, XPOF, NU, FLNC, CFLT, DOCN and several others. You can join by clicking the button below:
Here are my other newsletters…


Good morning and Happy Friday,
It’s been a choppy (short) week in the markets, TBH I’m not sure what the upcoming catalysts might be for the markets to keep moving higher (other than momentum & technicals) because Q2 earnings still 4+ weeks away, the FOMC speakers are still sounding hawkish and valuations stretched. Of course the markets can keep grinding higher because sentiment has improved, deep recession fears have dissipated, inflation is coming down and there’s still alot of cash on the sidelines from fund managers that have dramatically underperformed YTD and might need to play catch-up at some point.
The indexes coming off a mixed day with megacap tech doing the best (Nasdaq) and small/mid caps doing the worst (Russell).

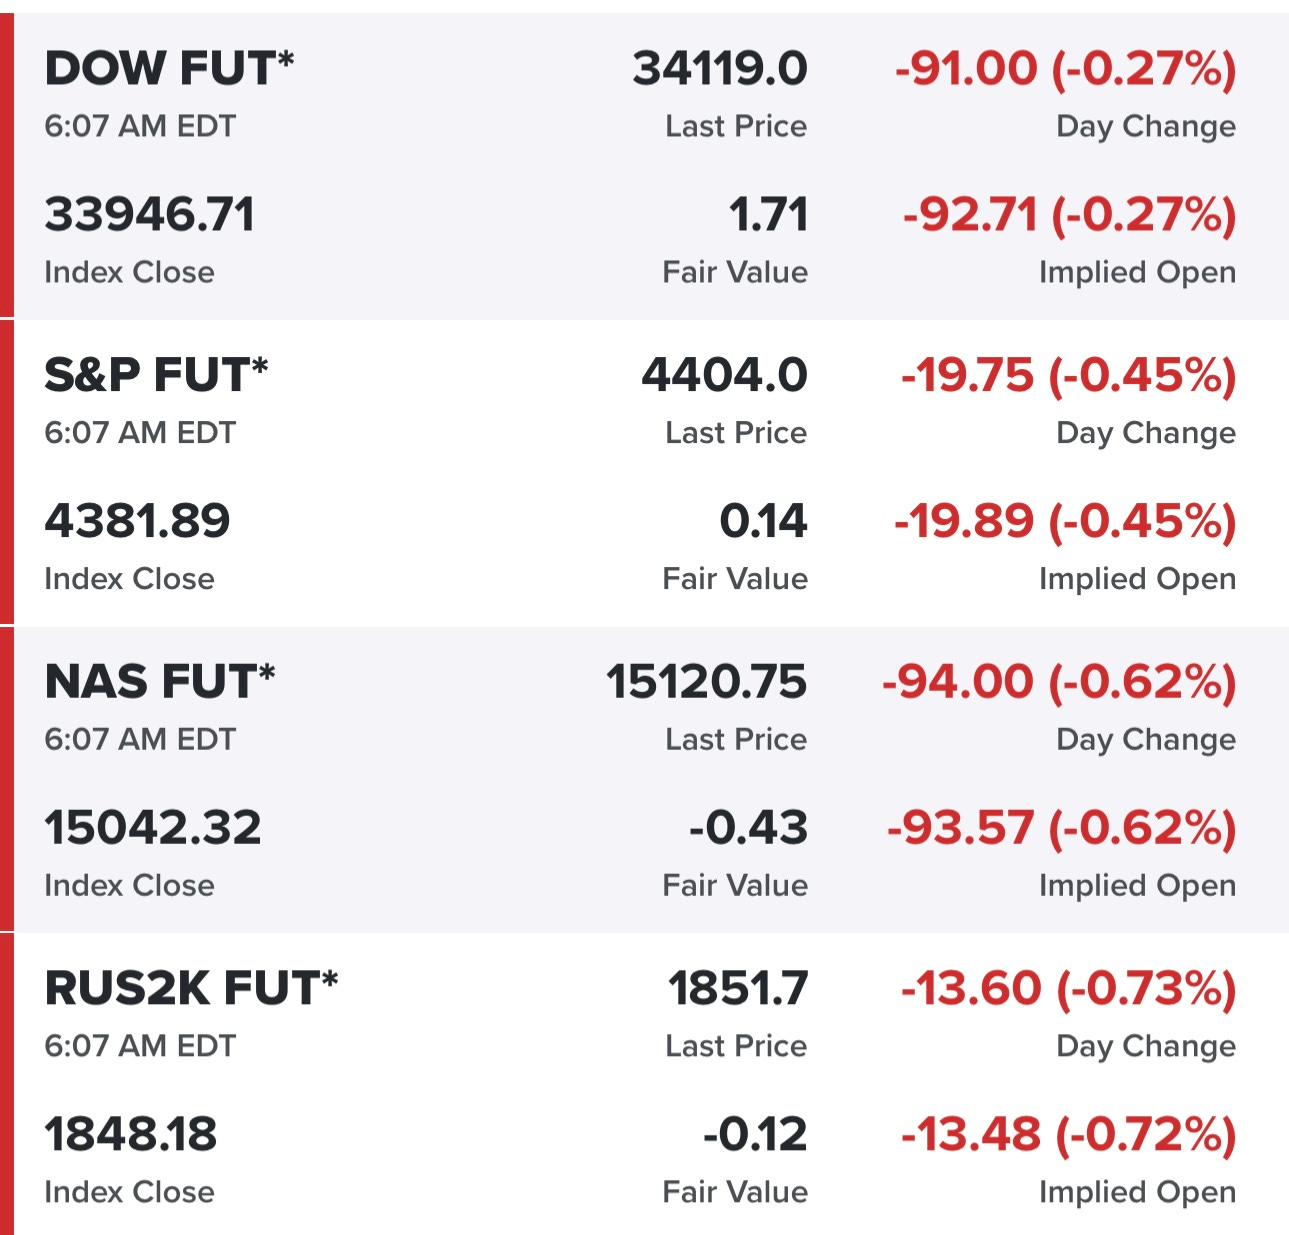
Futures in the red this morning…
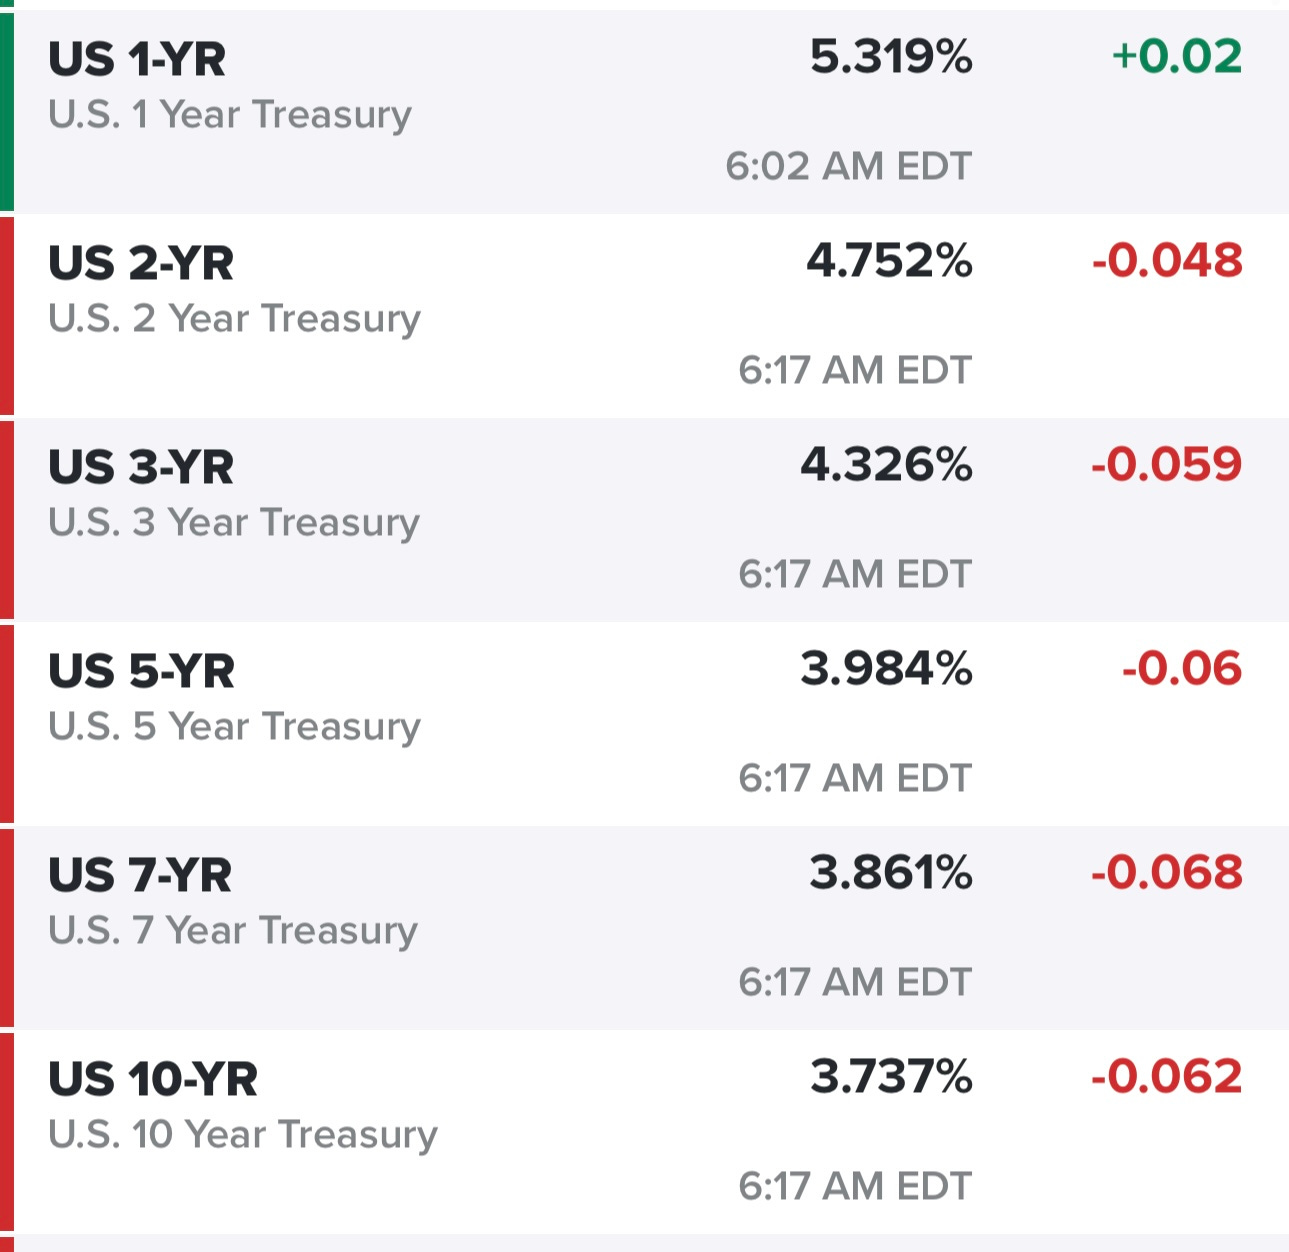
Yields down this morning…
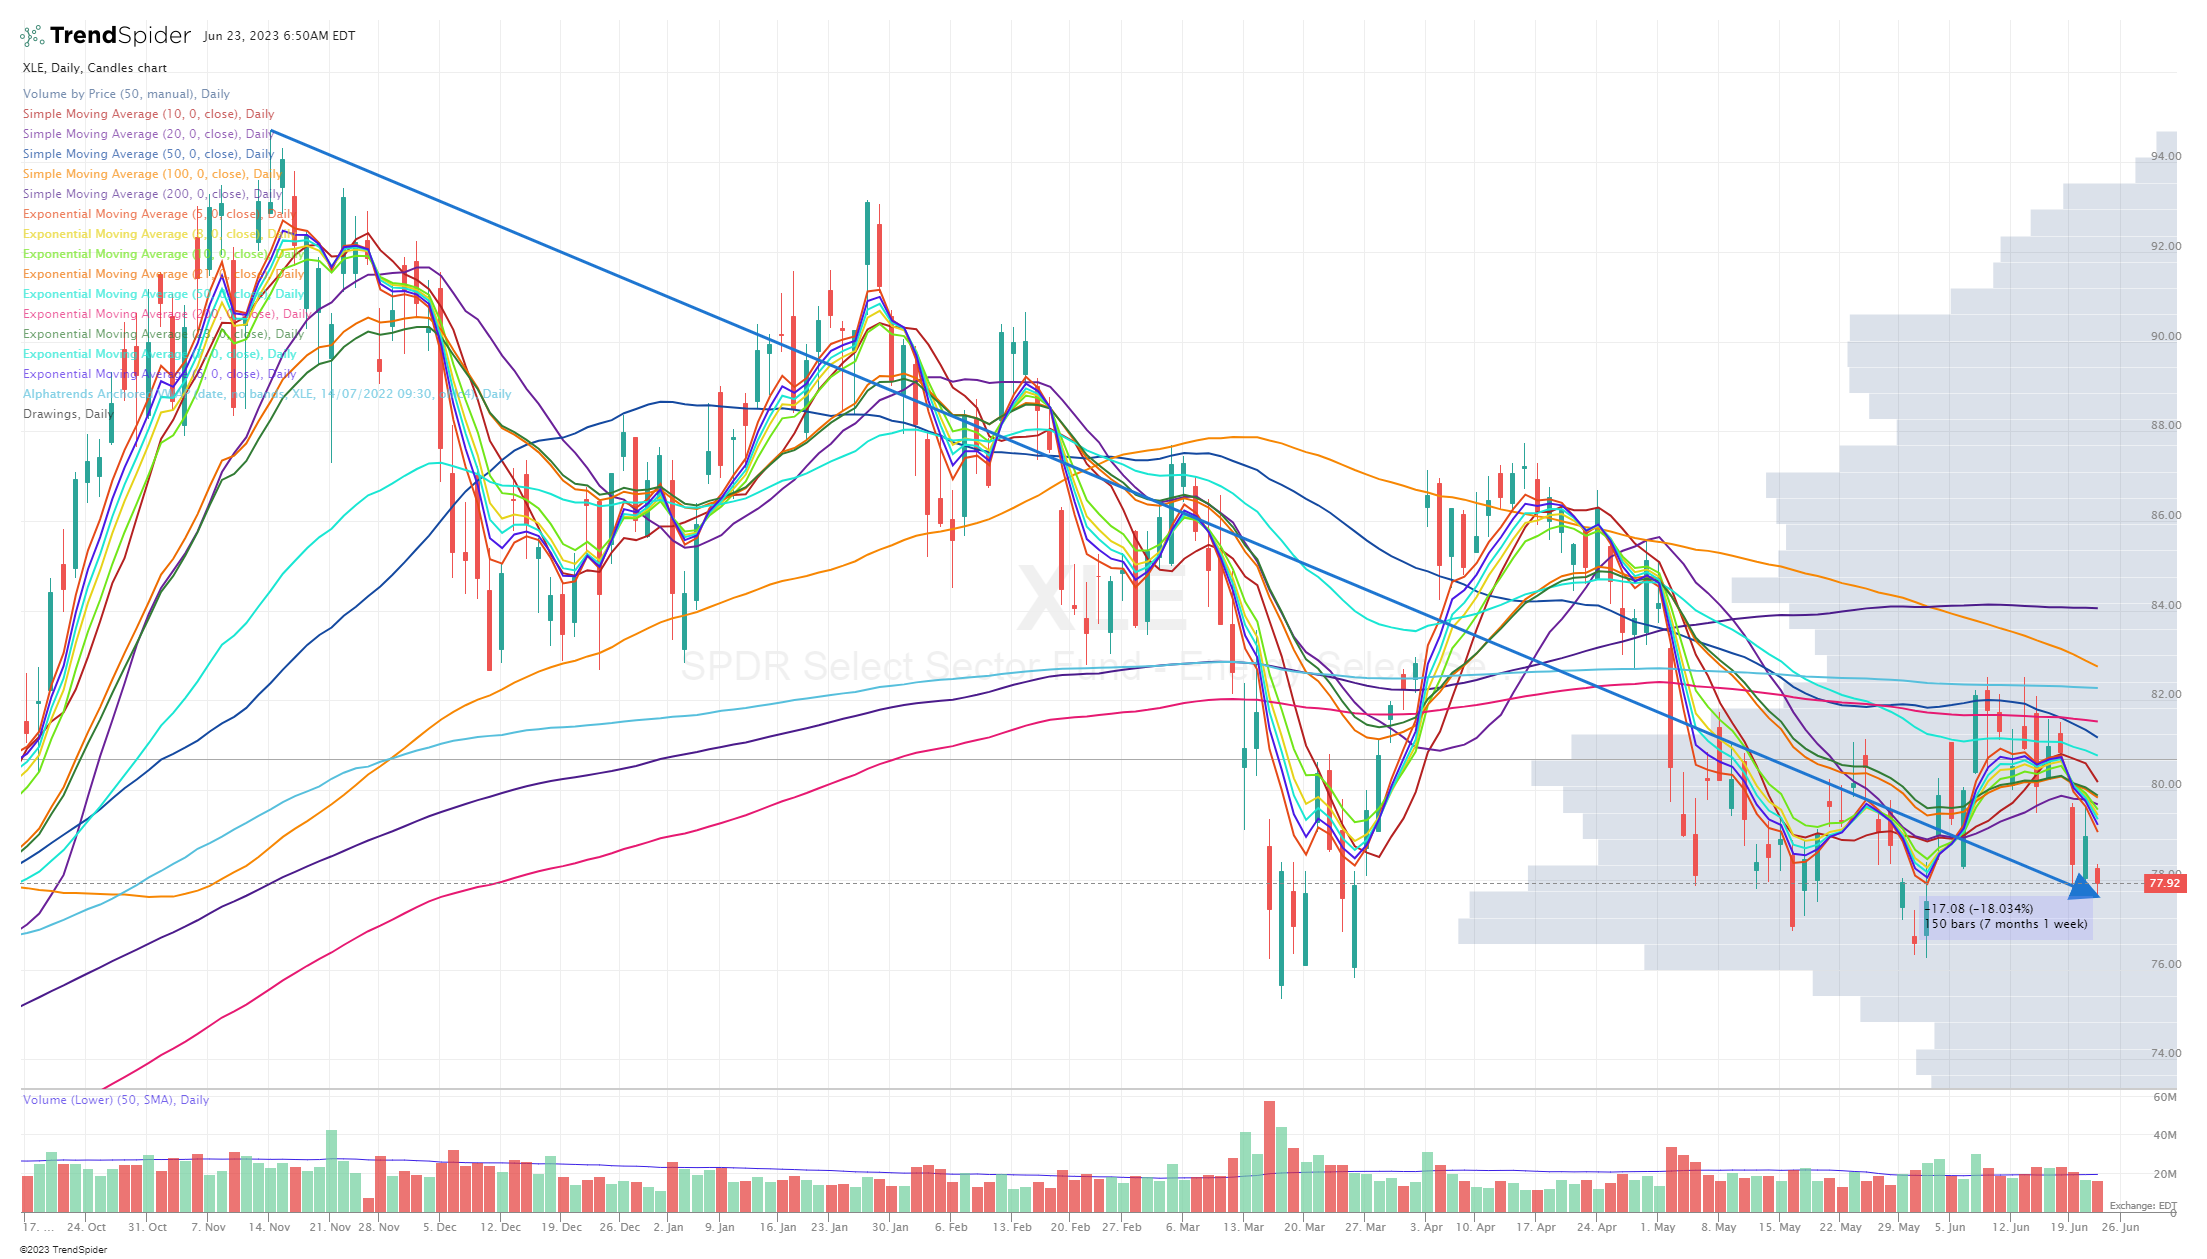
Oil still below $70 which means energy stocks will continue to underperform…
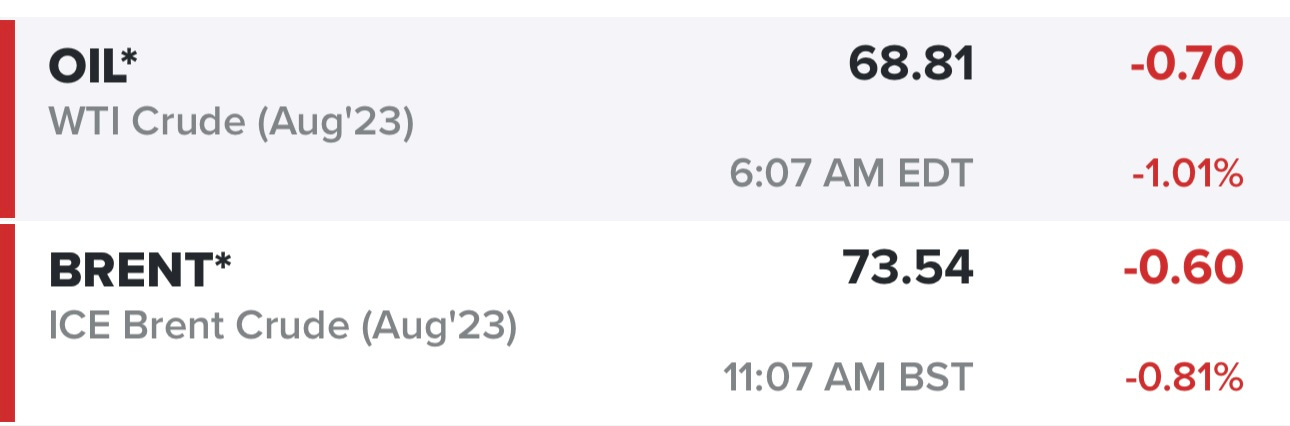
Whereas XLK (technology) is up +44% since November, the XLE (energy) is down -18% since November.

SPY losing the 10d ema but then bouncing and closing in the green, FWIW it bounced off the VWAP from the big gap up day on June 2nd which you can see here https://share.trendspider.com/chart/SPY/190748glfvt

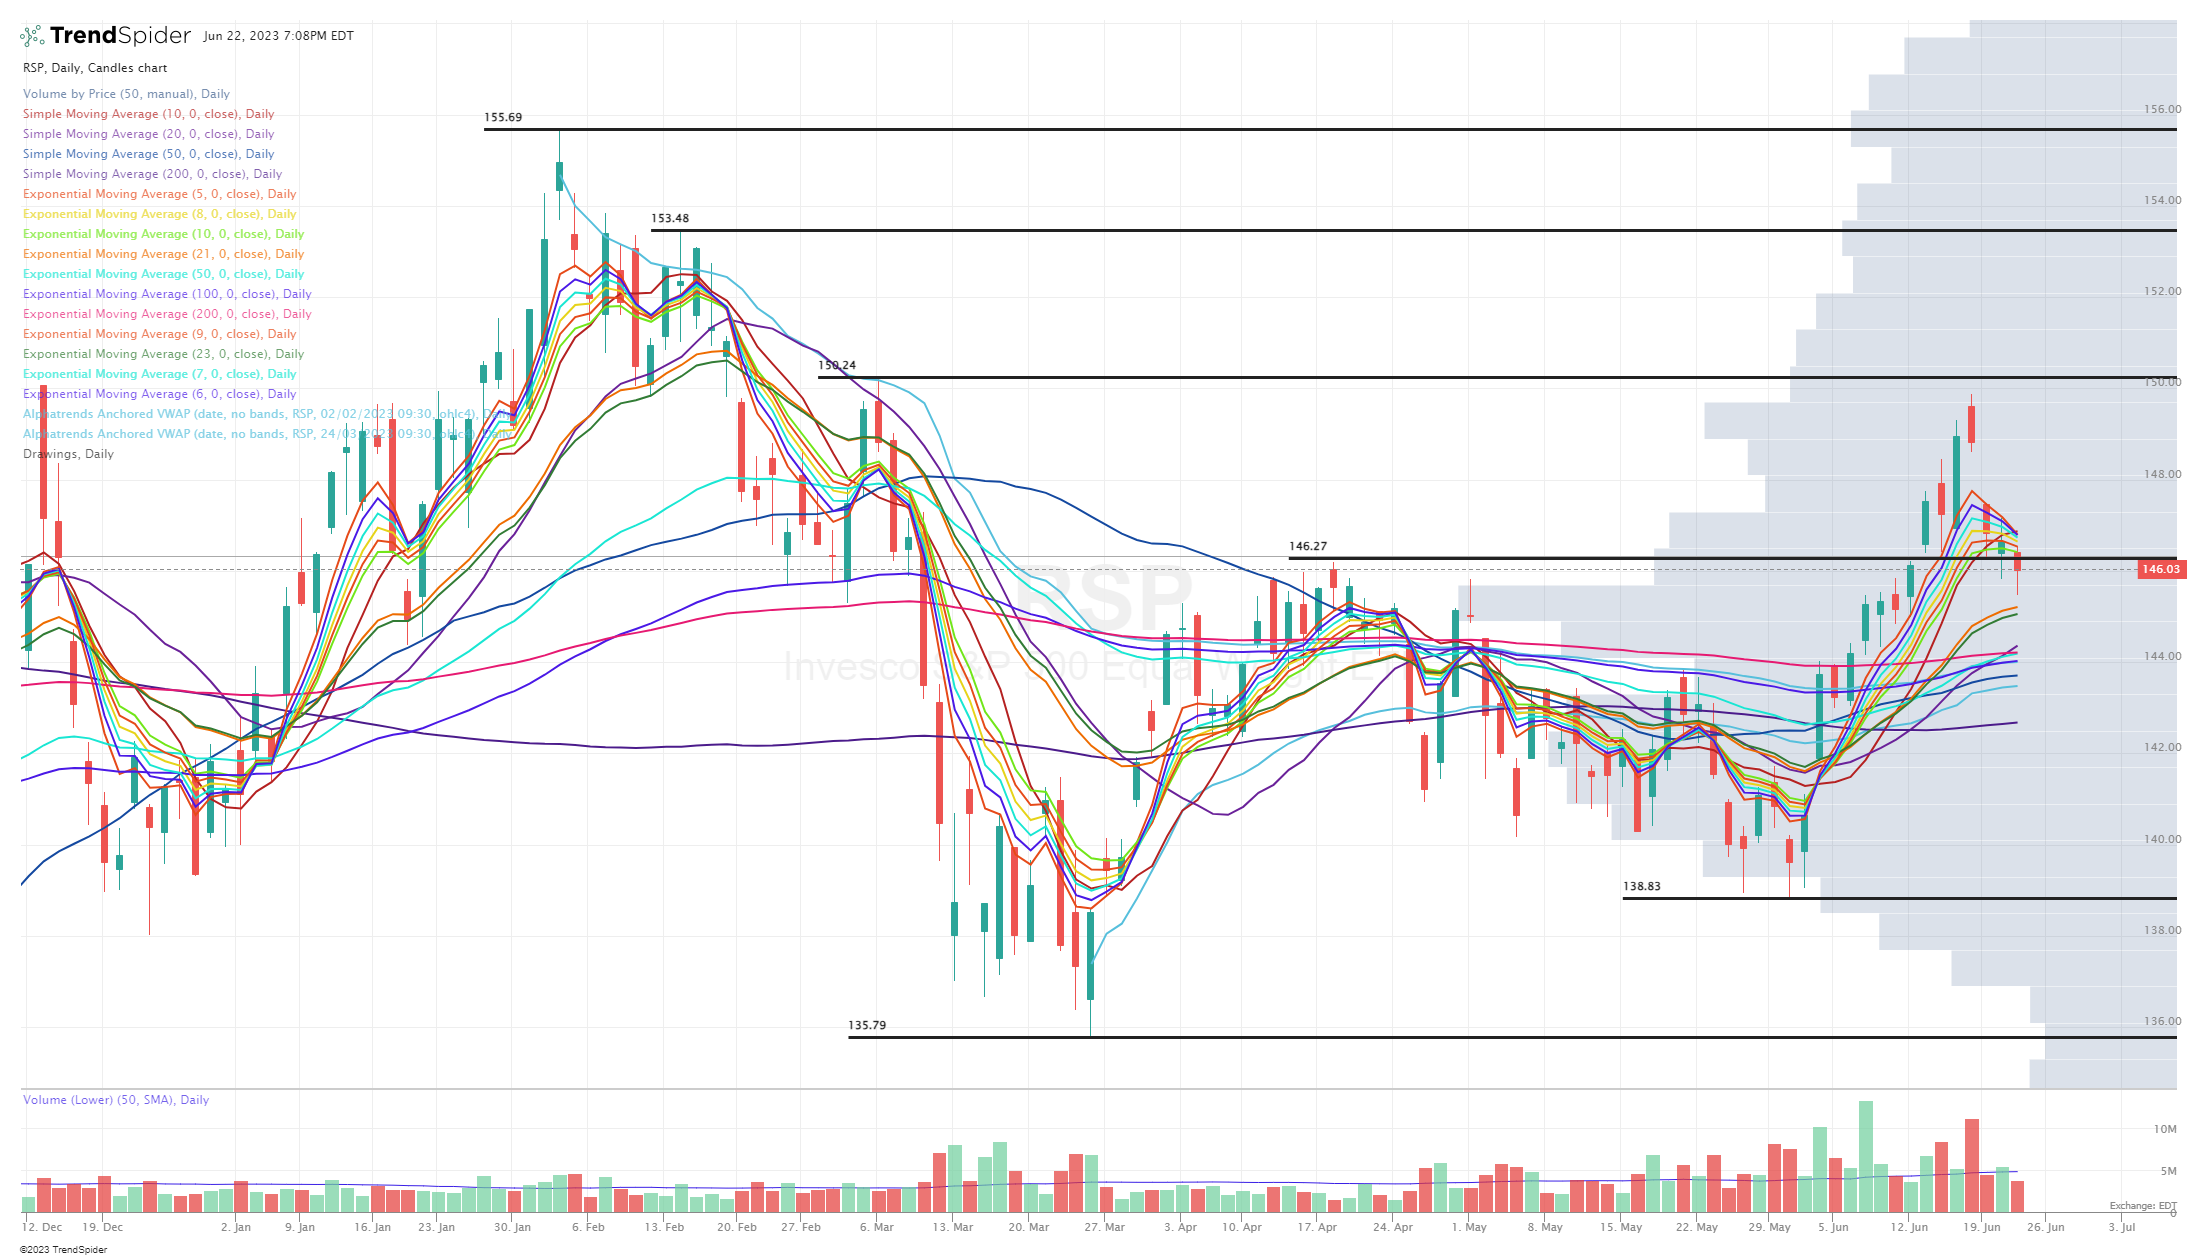
RSP losing that 146.27 pivot but finding support at the VWAPs from those two big green candles in early June… https://share.trendspider.com/chart/RSP/190748gmkjf
QQQ also losing the 10d ema before finding support at the VWAPs from early June… https://share.trendspider.com/chart/RSP/190748gmkjf

QQQE also losing the 10d ema before bouncing, similar to the other indexes/ETFs, curious to see if we retest the 21/23d ema in the next few days which is now approx 1% lower than yesterday’s close although it was less than 0.5% at the lows.

IWM underperformed yesterday compared to SPY and QQQ but did have a nice bounce off the 21d ema, I covered my IWM short on that bounce. I’ll get short IWM if it fails to hold the 200d ema.

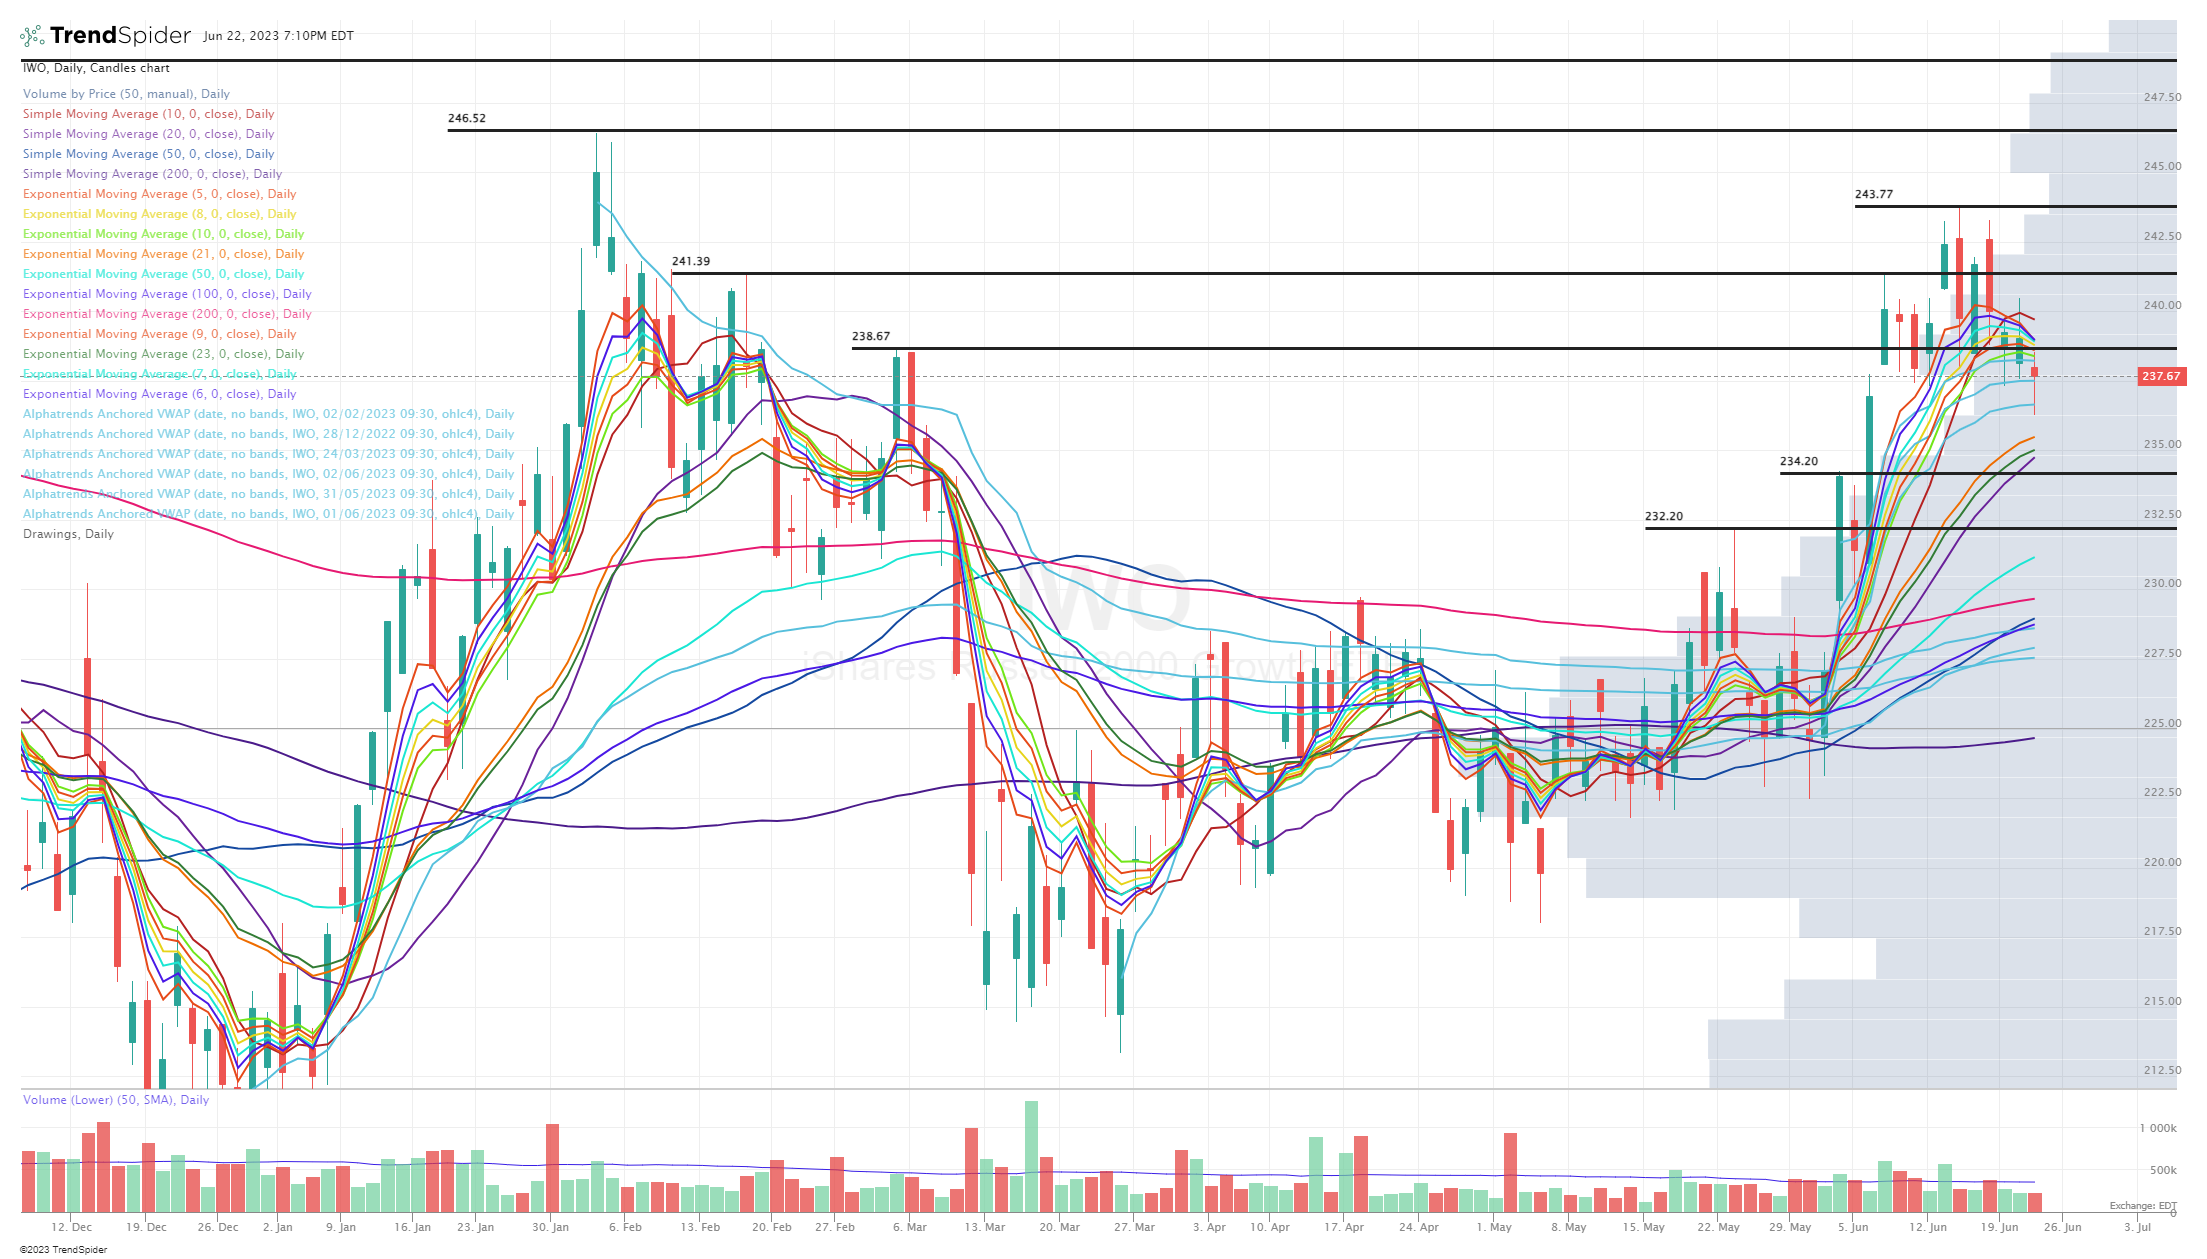
IWO still above the 21d ema but did bounce off the VWAP from the big gap up a few weeks ago.
ARKK with a big pullback in the morning then bouncing off the 23d ema, that’s when I covered my ARKK short and actually got long ARKK then sold 2 hours later for an easy but then got short again before end of day to hedge me overnight. ARKK actally finished in the green yesterday but it’s down -1.45% pre-market today, down to 42.05 pre-market with the 23d ema at 41.99 so I’ll be looking for the same play this morning. I’ll cover my ARKK short if it bounces off the 23d ema but I’d get short again if it fails to hold the 23d ema. I’ll also get long ARKK on the bounce off the 23d ema with a stop limit order just below the 23d ema. If I cover my short and get long at the 23d ema, I’ll sell my long and get short with the same limit order.

Below the paywall is my current trading portfolio and watchlist with charts, entry points, stop losses, etc. (PS: my investment portfolio is different and only available to my Stocktwits subscribers and my Substack deep dive subscribers)
Please note that I have changed the links/URLs for my webcasts as well as my portfolio spreadsheet — I have to do this at the beginning of every month so former subscribers no longer have access to the content that is exclusive for paid subscribers.