Trading the Charts for Thursday, July 13th
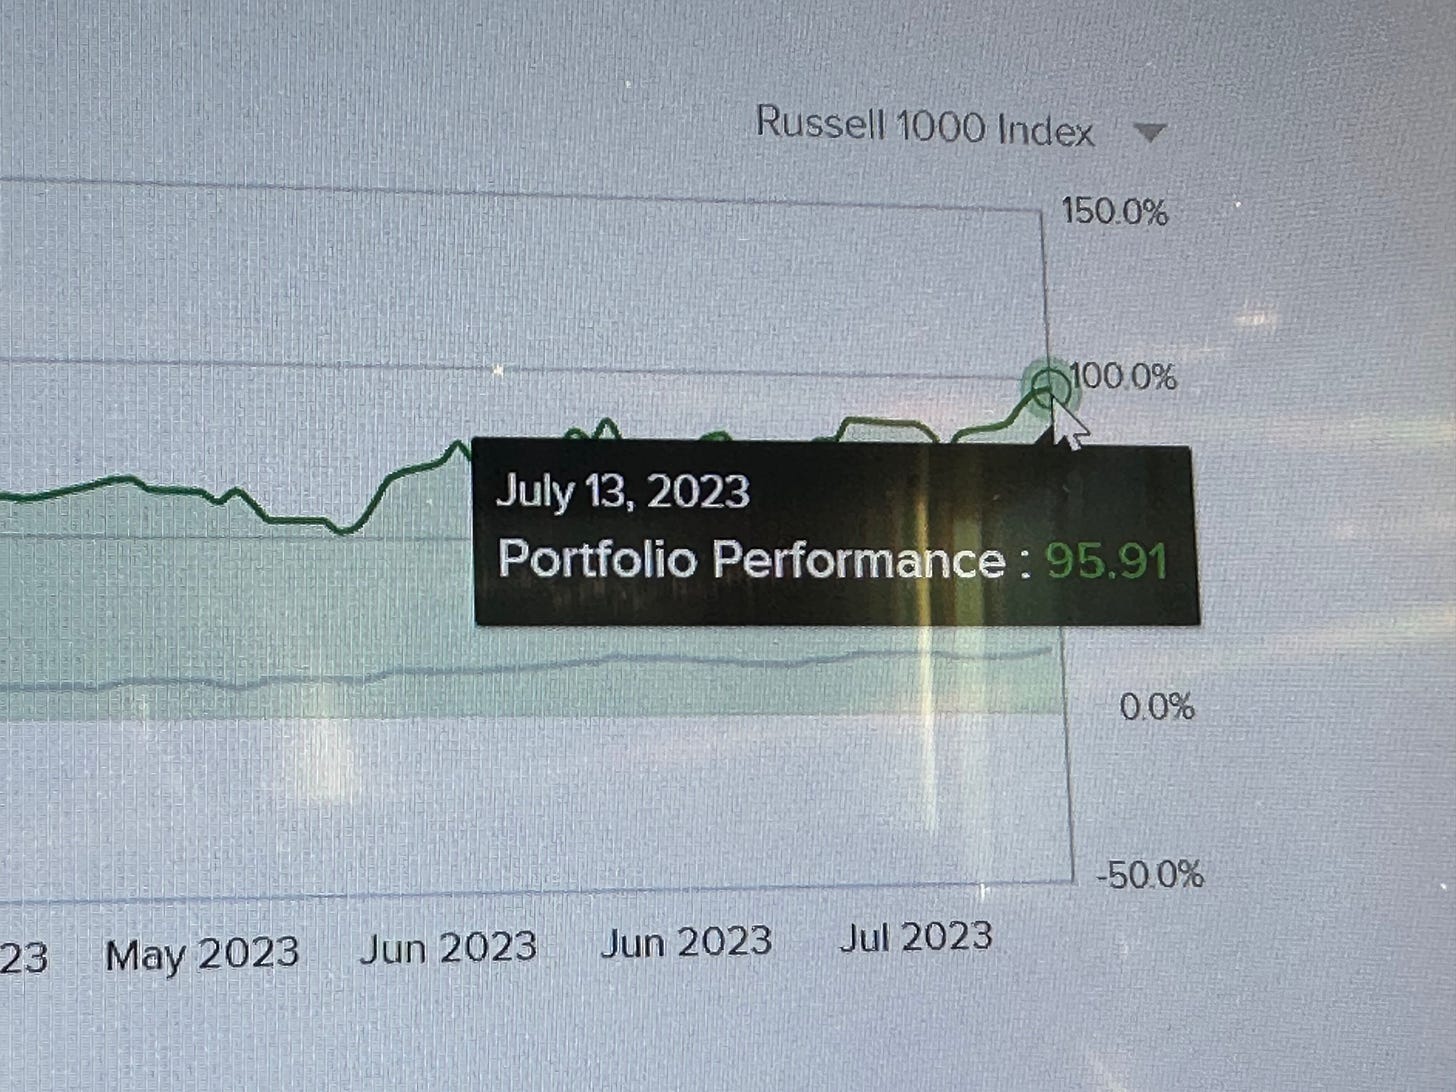
I also run a Stocktwits room where I’m active throughout the day but post mostly about my investment portfolio which is up ~95.9% YTD, I’m currently offering a free trial if you’d like to check it out.
Here are my other newsletters…
Good morning and Happy Thursday,
We get PPI this morning which hopefully doesn’t undo all the good we got yesterday from a cooler than expected CPI which came in at 3% YoY on headline CPI and 4.8% YoY on core CPI.
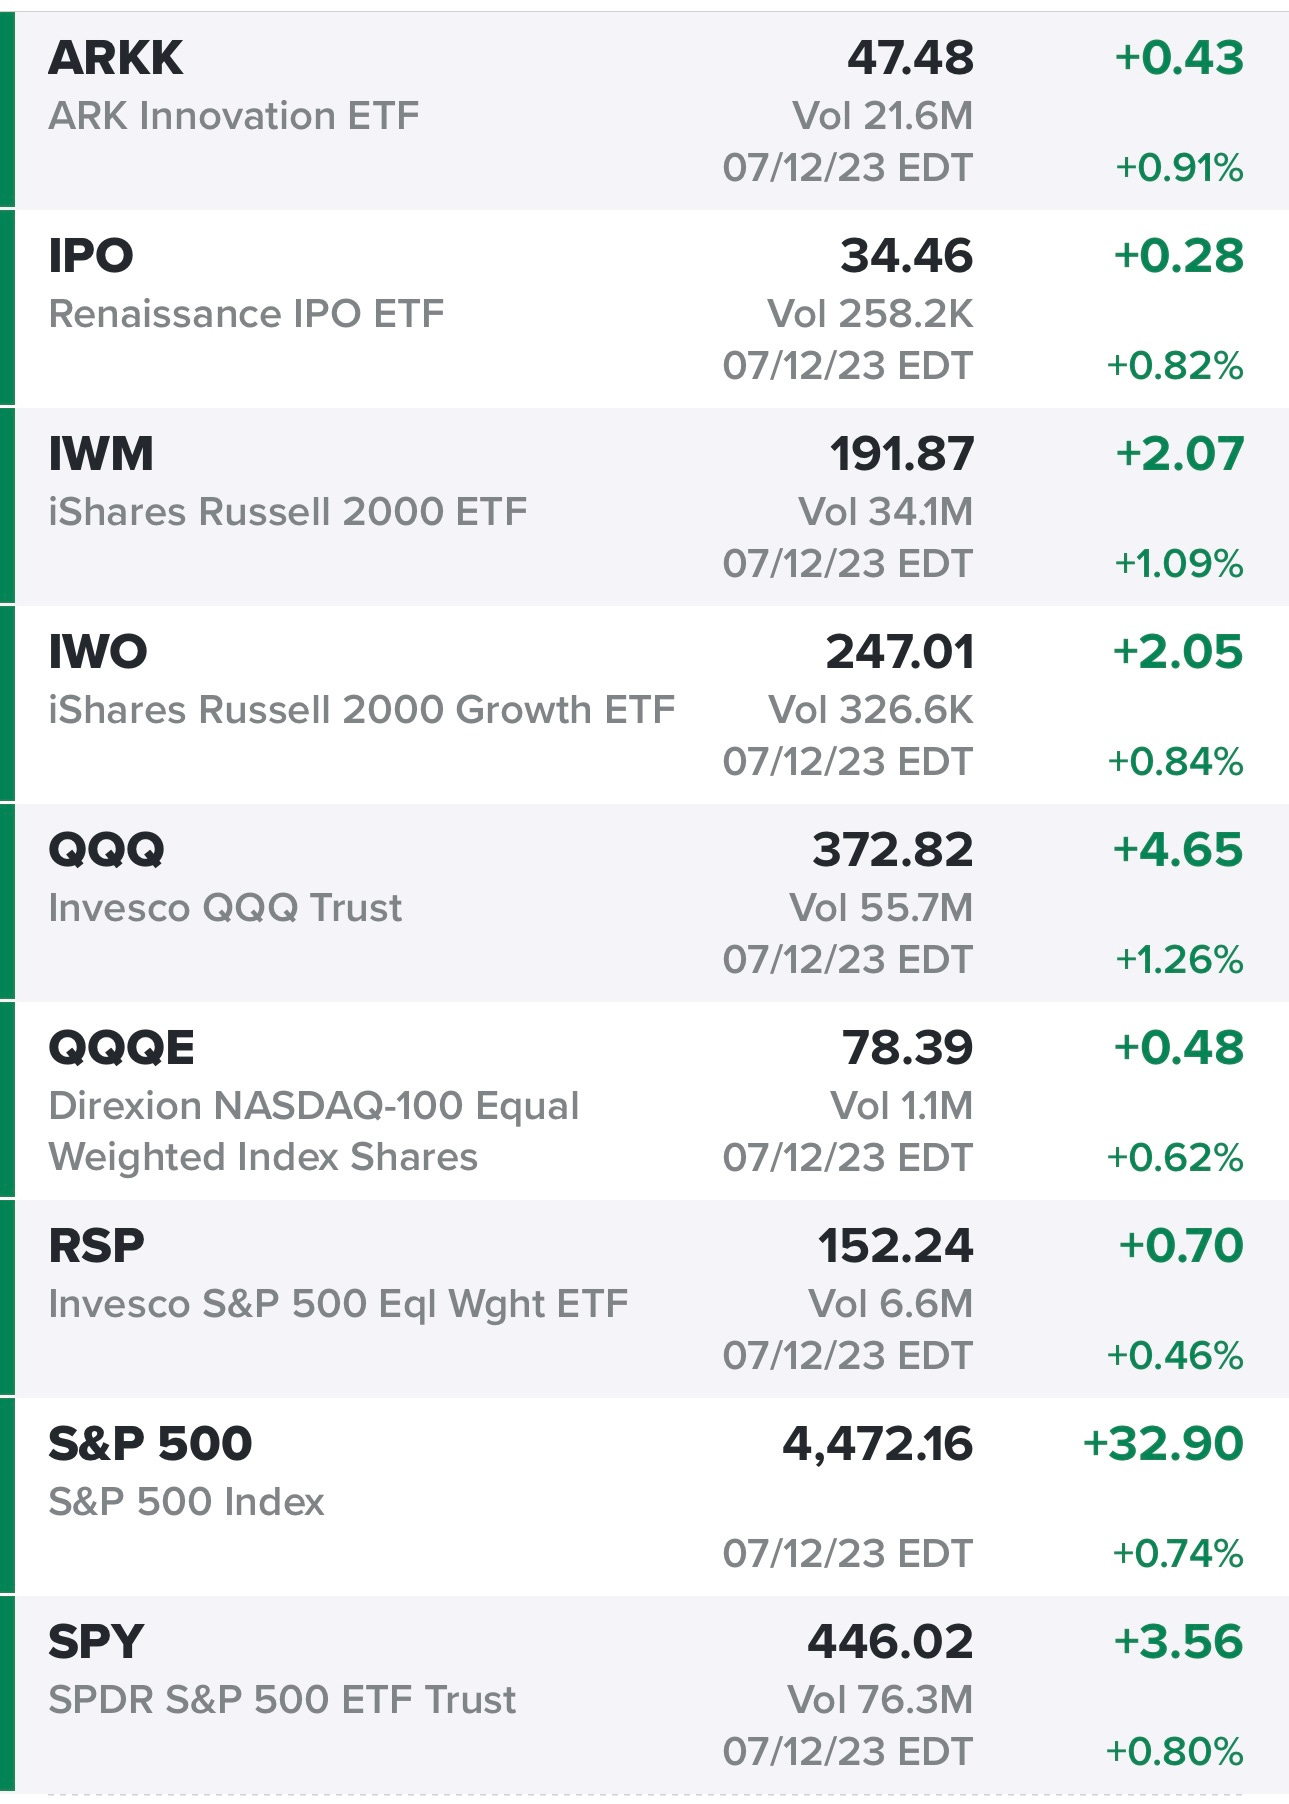
The markets were strong yesterday although we did fade off the morning highs…
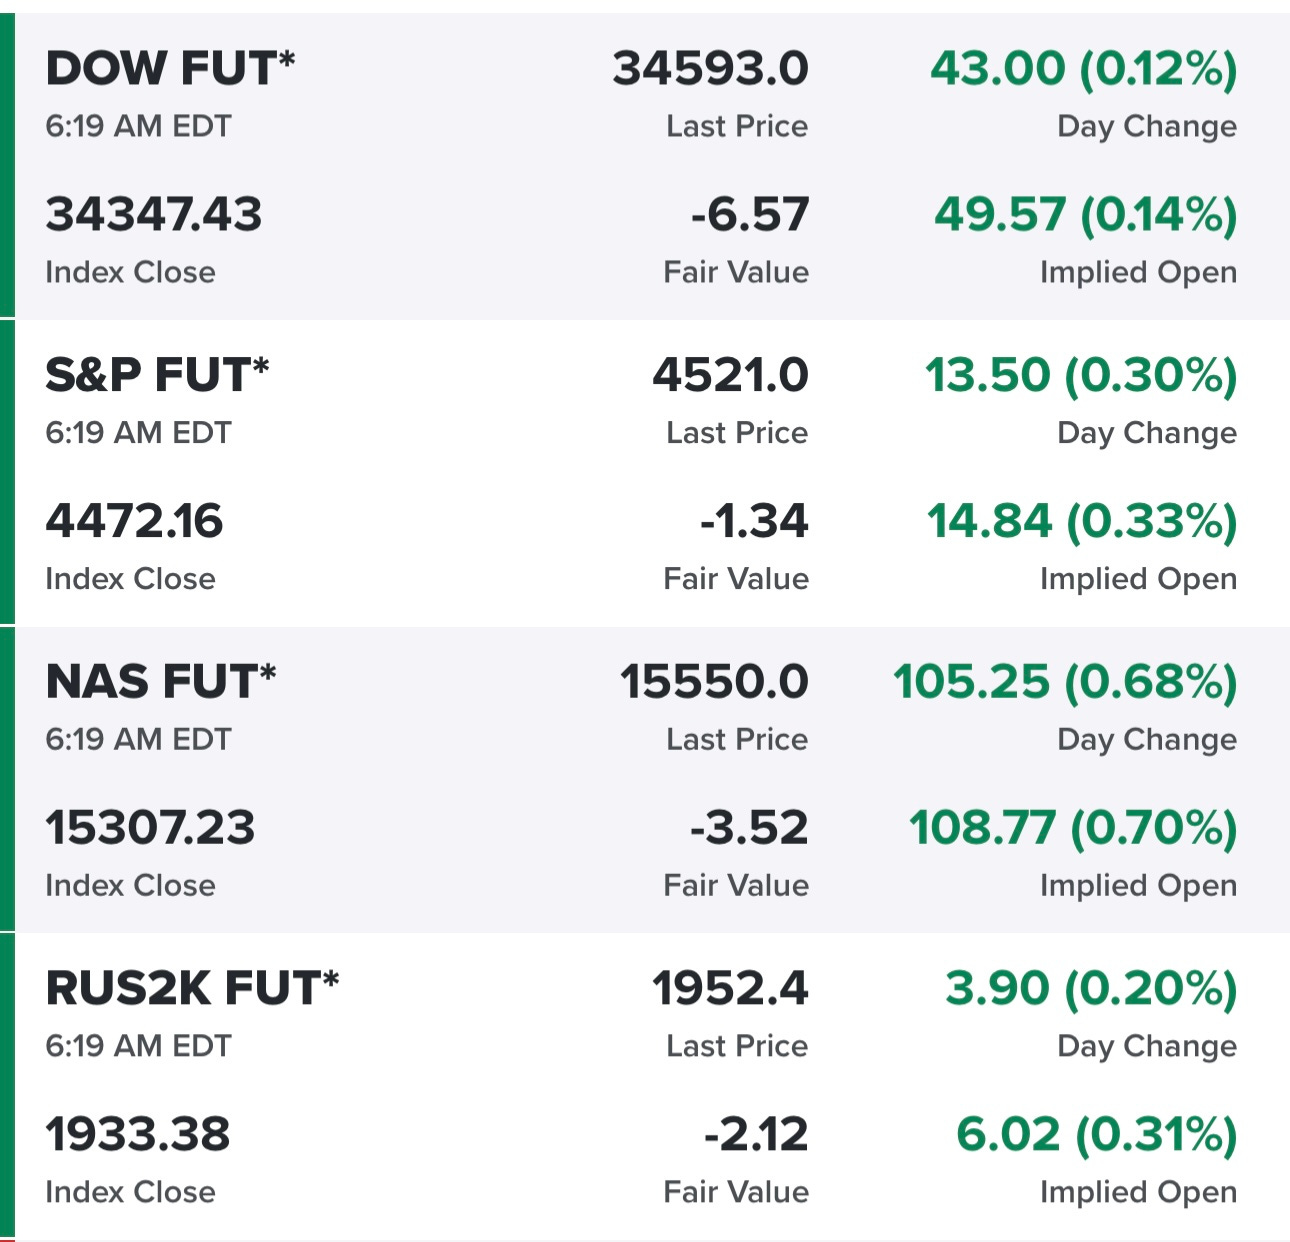
Futures looking strong this morning, we also got strong numbers from PEP (Pepsi) and DAL (Delta)…
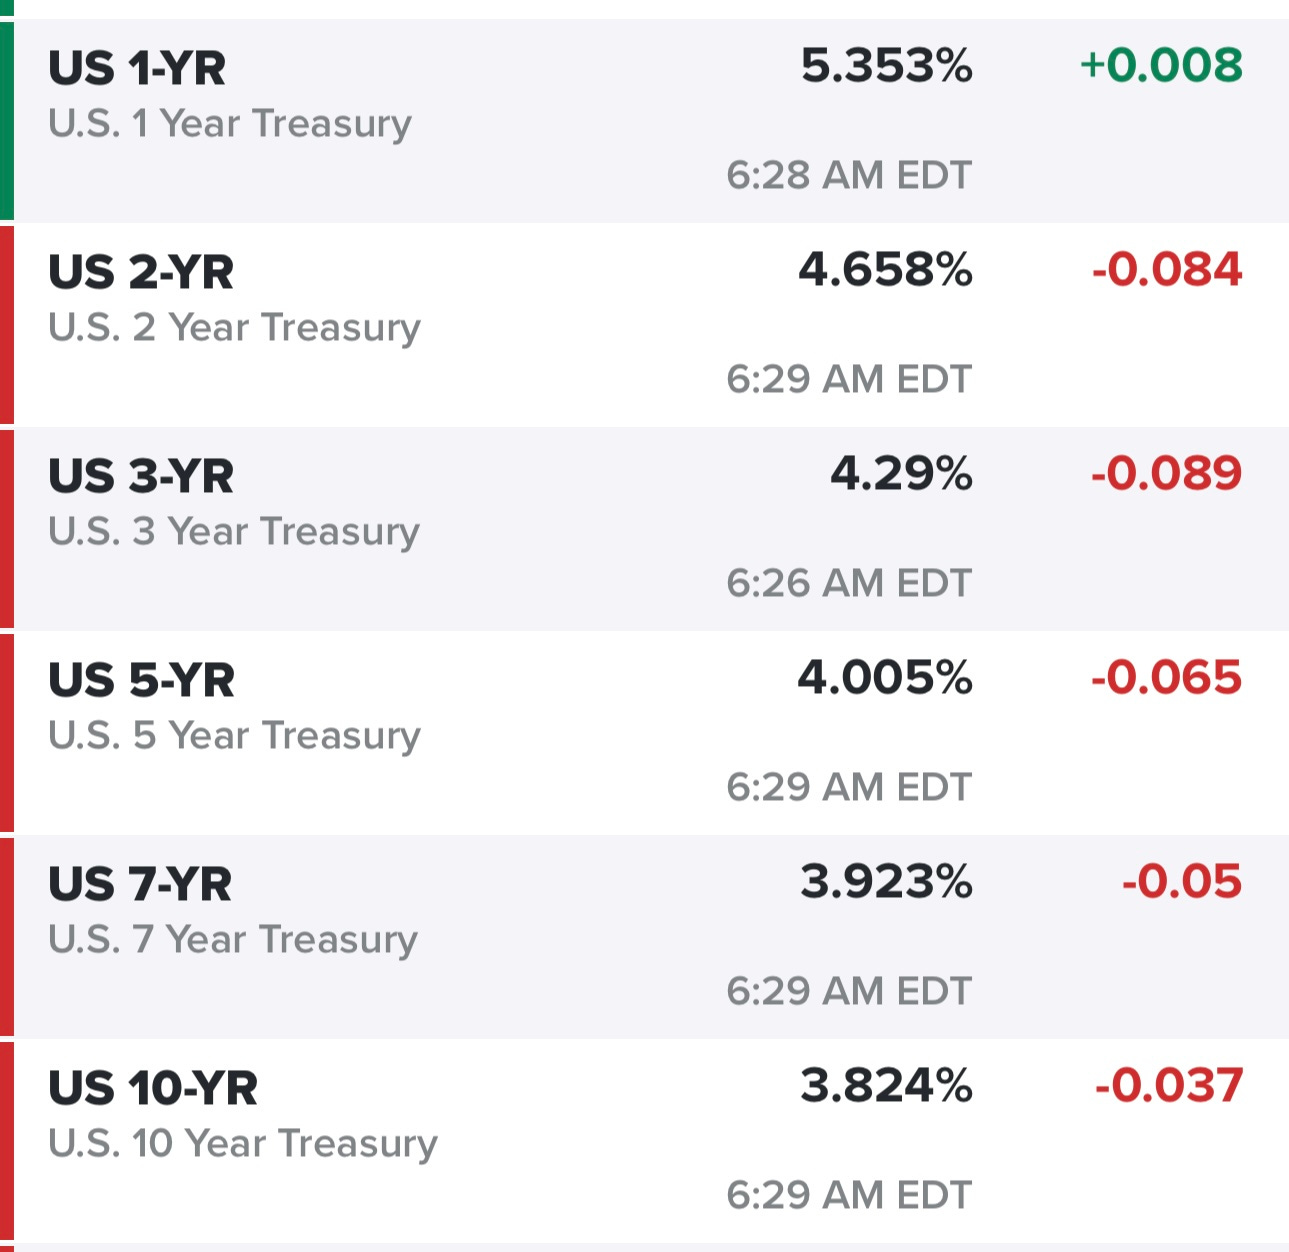
Yields down again this morning, the 10Y yield has dropped 25+ bps in the past week which is pretty significant…
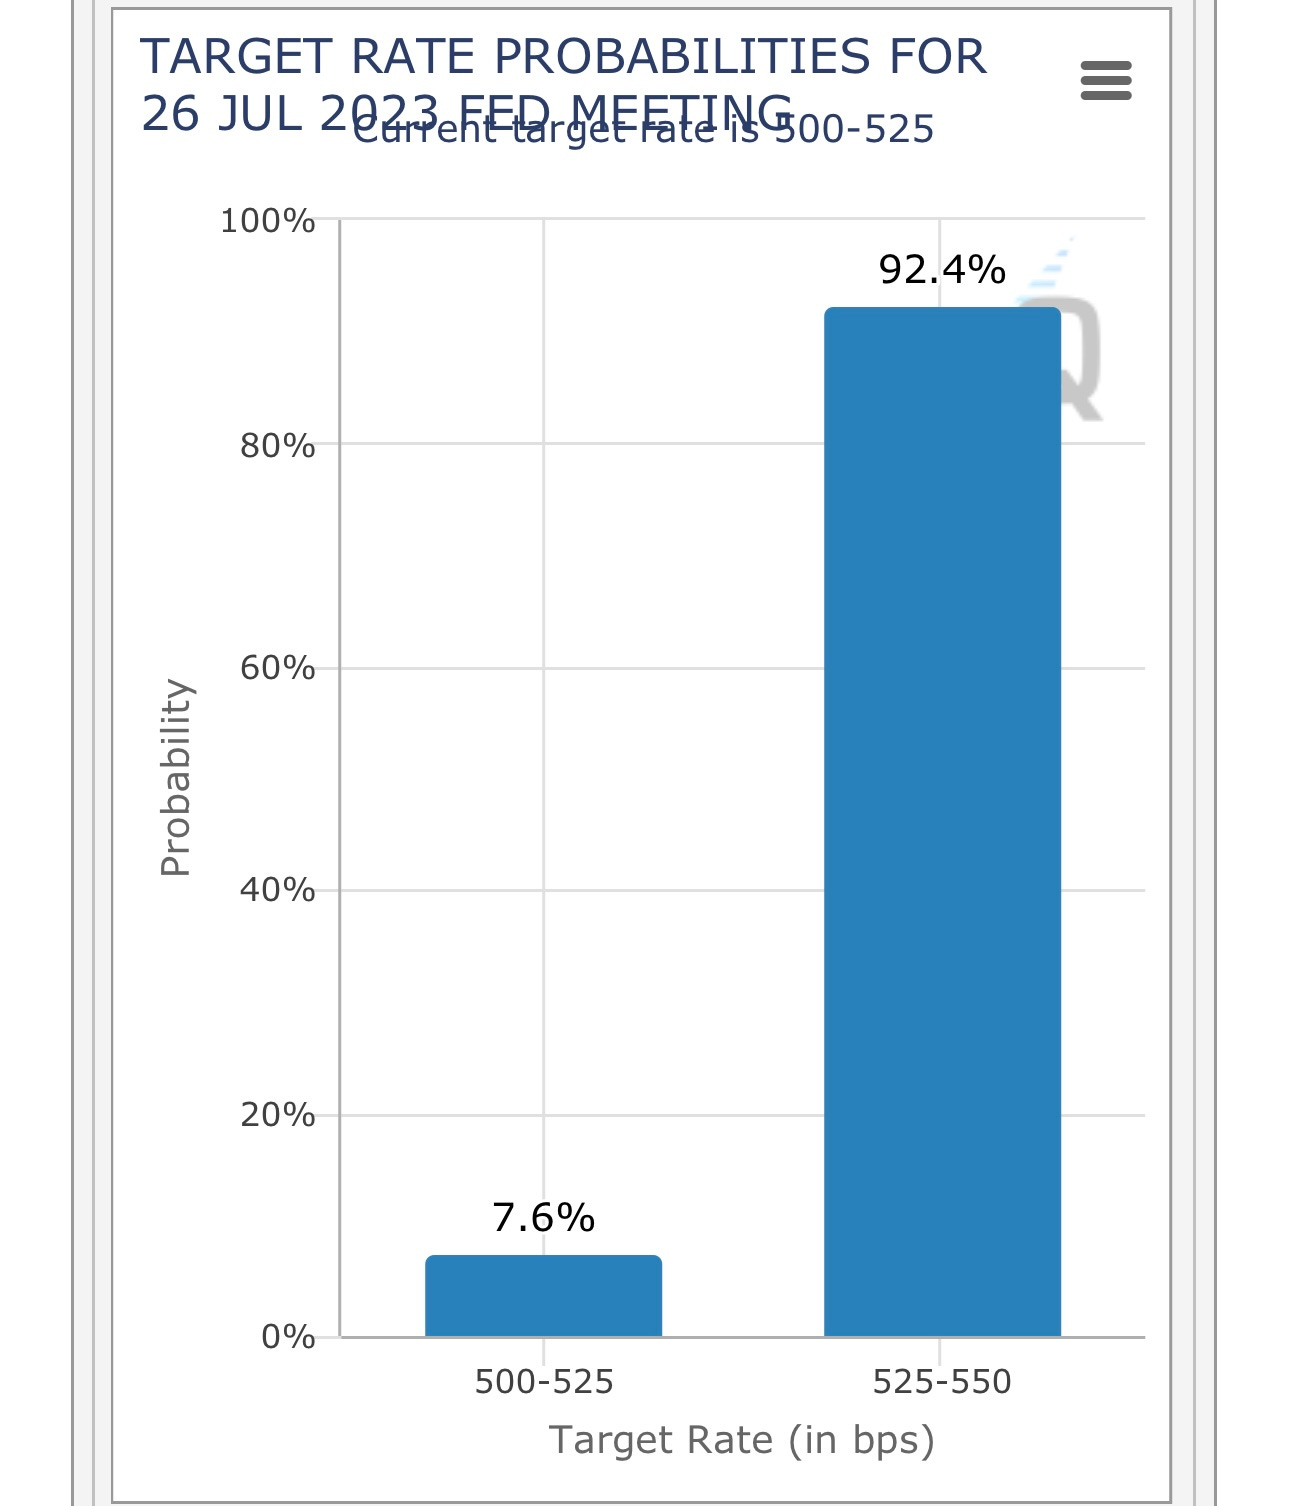
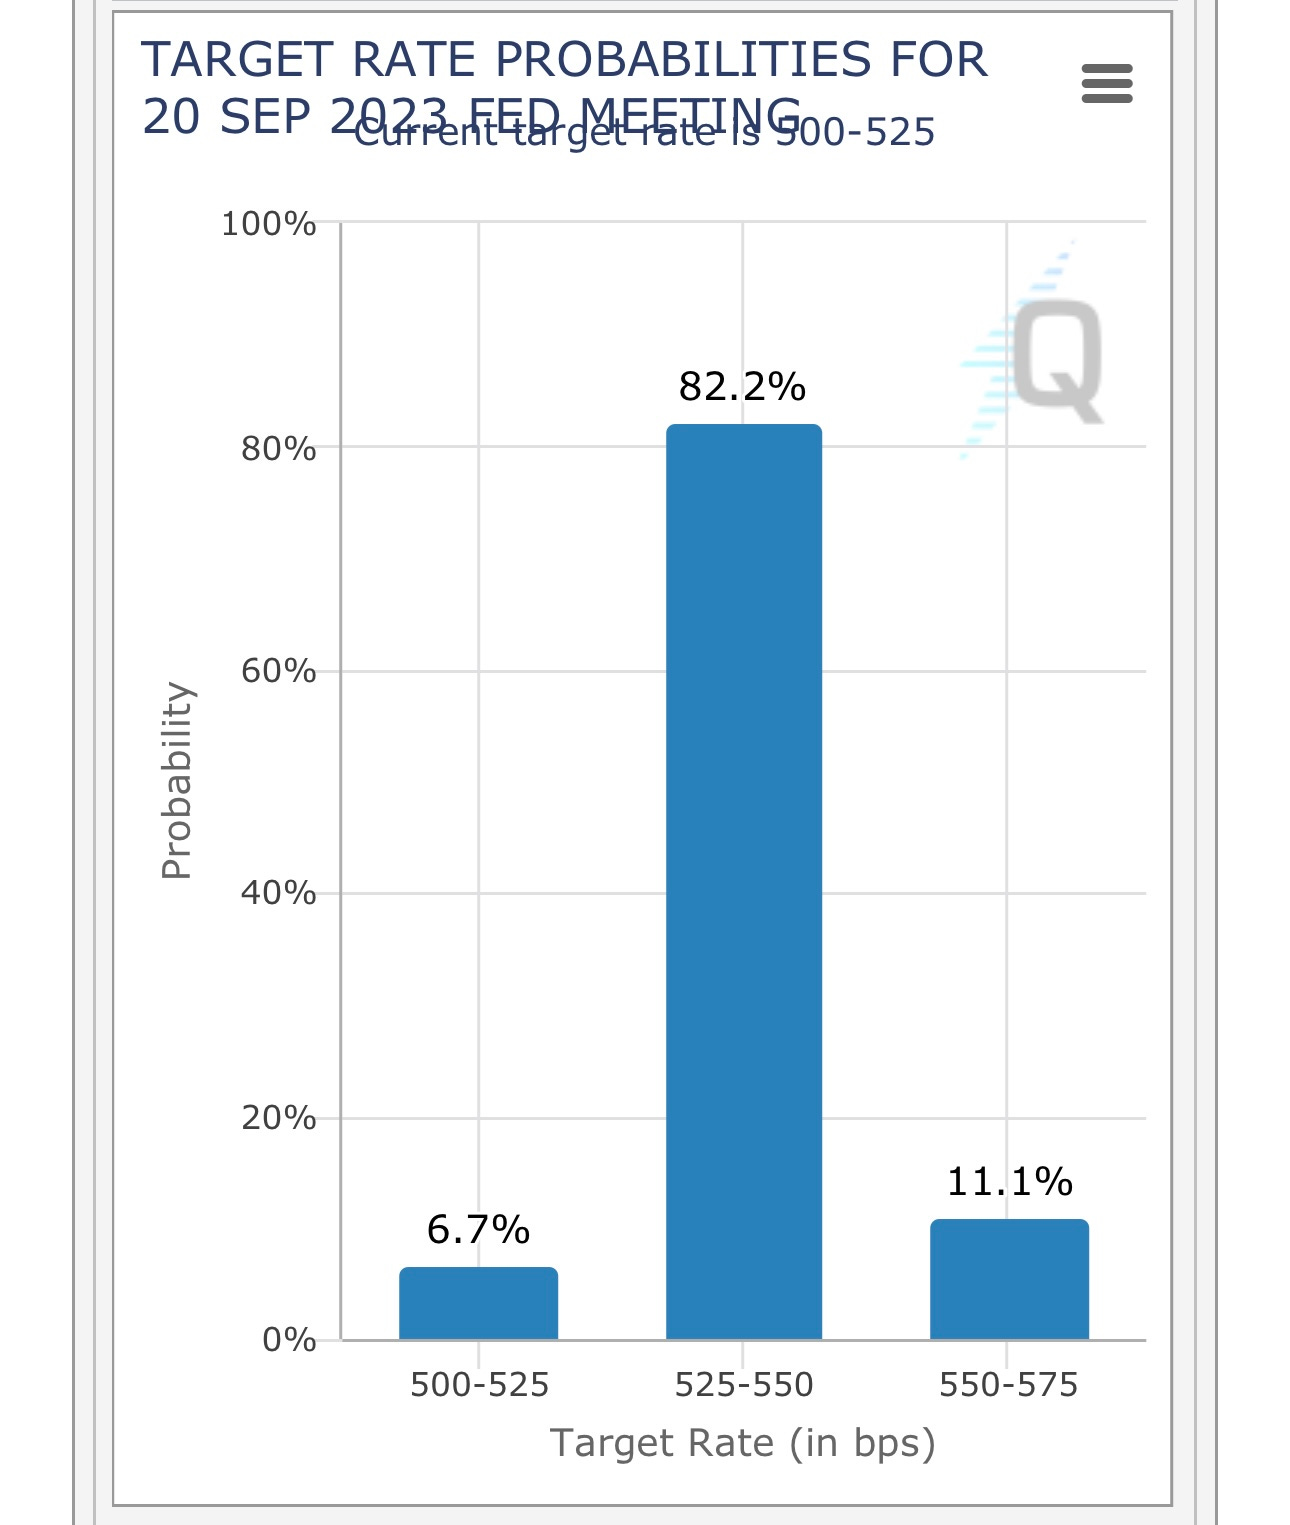
Looks like a 25 bps rate hike is still guaranteed for later this morning but chances of a September rate hike continue to fall especially after that cooler CPI report yesterday…
SPY gapped up above the recent highs, I was expecting a pullback to the 444.28 high but never got there, if we pullback this morning I’d be looking for a bounce there
RSP gapping up yesterday, not sure if that gap ends up getting filled in the next couple weeks, next area of resistance would be 153.48
QQQ gapping up yesterday but unable to push through the highs from June16th however yesterday was a new 2023 closing high.
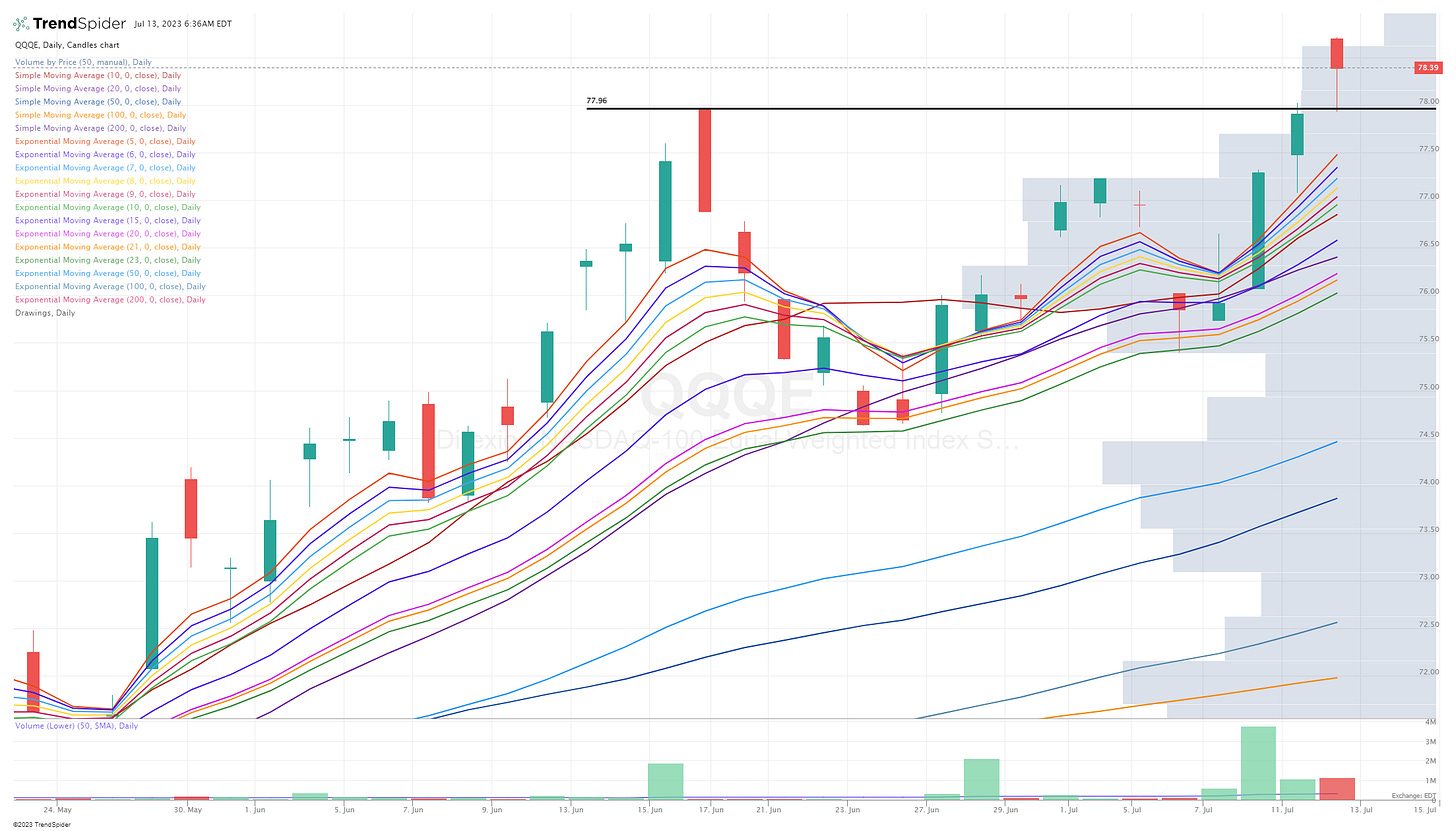
QQQE gapping up yesterday then pulling back and bouncing off the June 16th pivot line which is textbook technicals, I need to find out if there’s a 3x leveraged version of QQQE because yesterday on that bounce would have been the perfect place to use it.
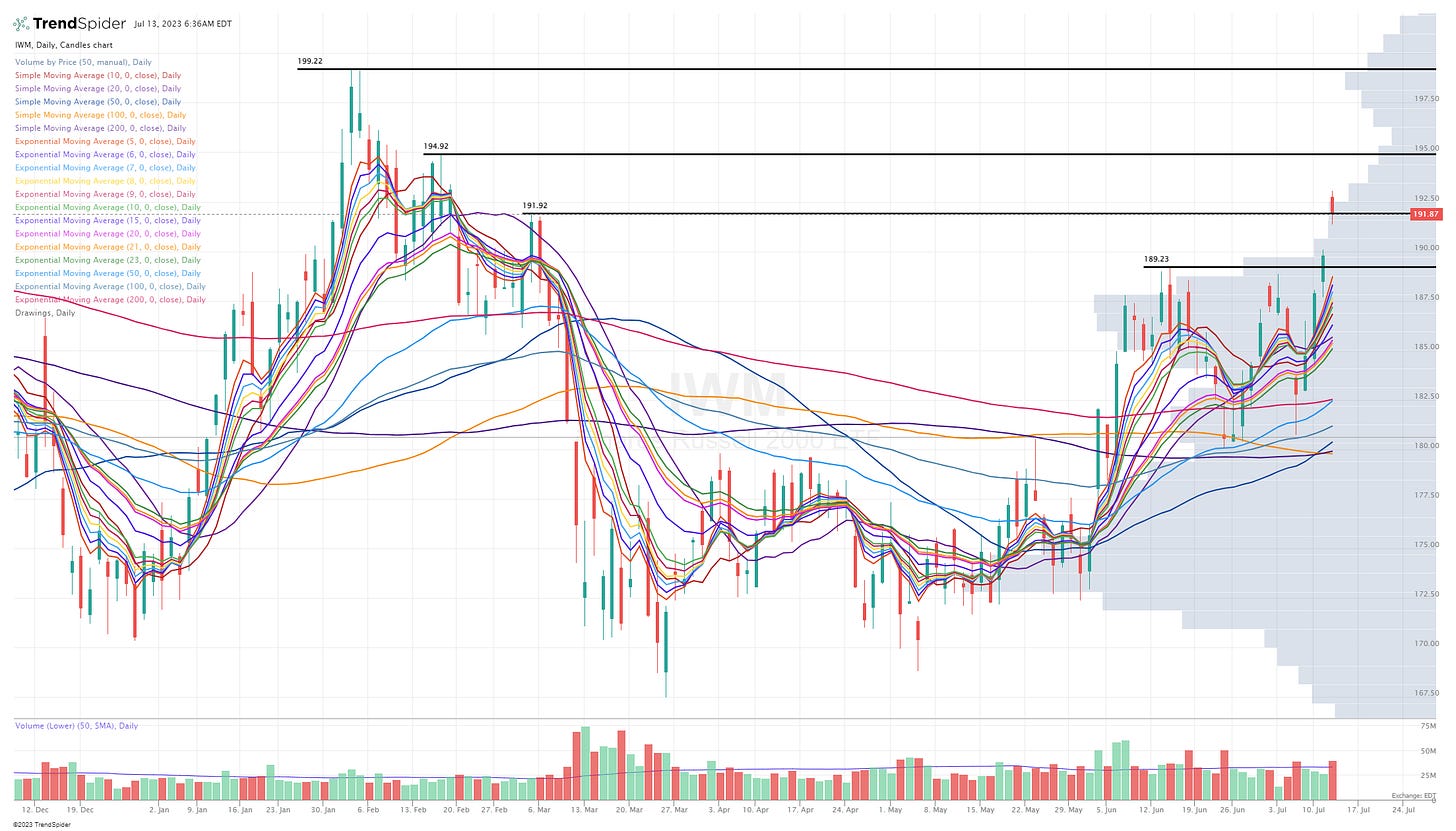
IWM gapping up yesterday to the 191.92 resistance line and ultimately closing just below it.
IWO with a perfect chart similar to QQQE, gapping up yesterday above the February high of 246.45 then pulling back and bouncing off that pivot line.
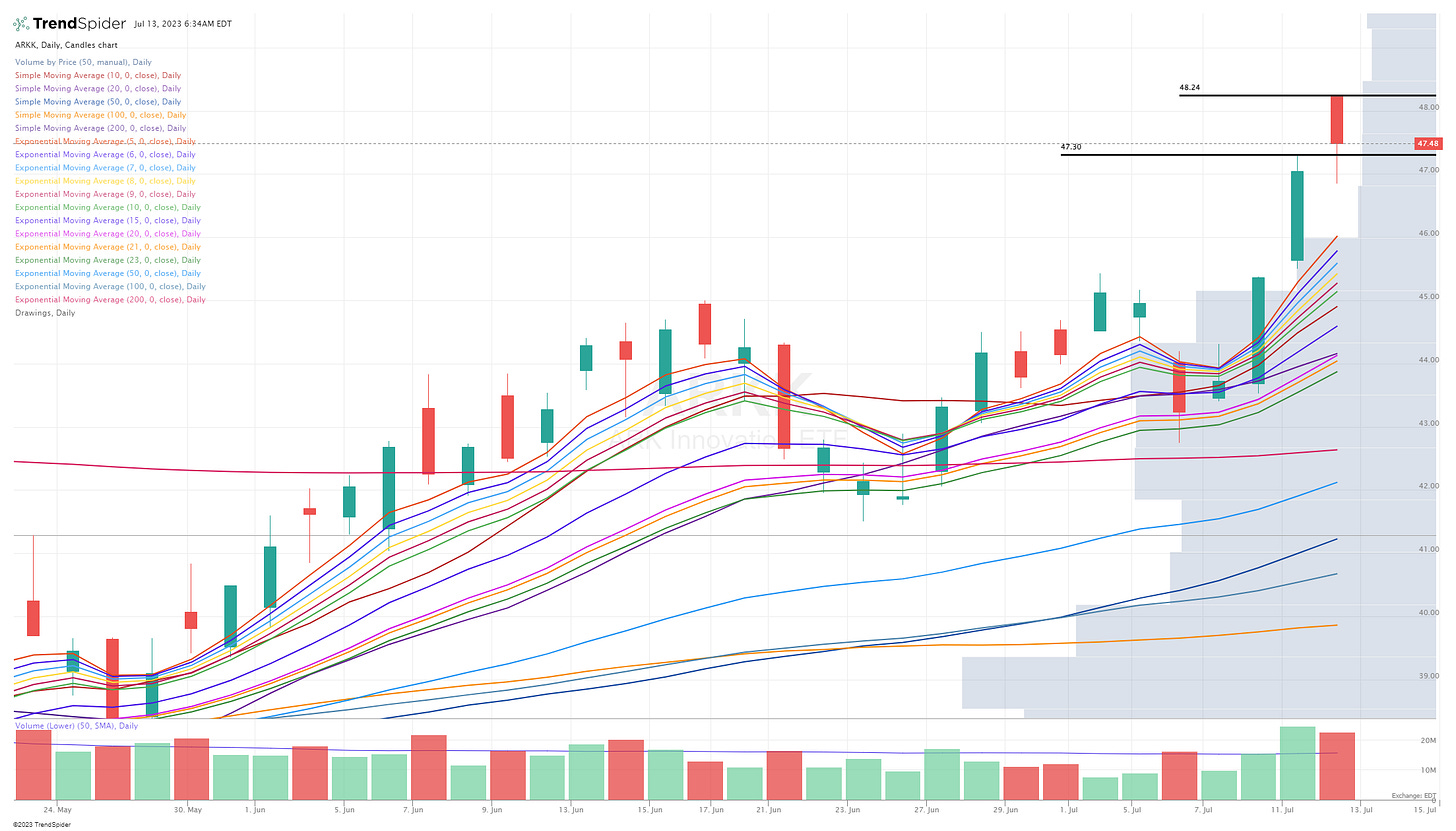
ARKK gapping up yesterday then pulling back below the previous day highs before bouncing and closing up just under 1%, with ARKK up another 1.7% pre-market it looks like we might take out the highs from yesterday at the open.
This is the weekly chart for ARKK, very bullish, breaking out of the recent base.
Below the paywall is my current trading portfolio and watchlist with charts, entry points, stop losses, etc.
PS: my investment portfolio is different and only available to my Stocktwits subscribers and my Substack deep dive subscribers


