Trading the Charts for Friday, December 15th
In order to read this entire newsletter you’ll need to become a paid subscriber by clicking the button below. Paid subscribers get full access to my trading portfolio (up +95.4% YTD), watchlists with charts, daily activity (buys & sells plus entry prices & stop losses, performance, etc) and my daily webcasts.
I also run a Stocktwits room where I post throughout the day about my investment portfolio (up +128.9% YTD) with full access to my holdings, performance, daily activity, market commentary, quarterly earnings analysis, daily webcasts and more.
Here’s my other newsletter if you want my weekly deep dives…
Link to my CPI spreadsheet which I update monthly… https://docs.google.com/spreadsheets/d/1zCrp1FULJszcUsvxbuNAGbcIQiIj1stvBIm-JFwWCRE/edit#gid=0
Yesterday the $IWM (Russell 2000) closed +22.8% off the October lows, which means it only took 7 weeks to go from a 52 week low to 52 week high. That's never been done before.
I think the $IWM is setting up for a big 2024 and here are 5 reasons why:
1) $IWM is still -18.5% below the 2021 highs
2) $IWM is still only back to December 2020 levels
3) $IWM is still only +13% above the pre-pandemic highs in August 2018
4) The total market cap for $IWM is below $3 trillion which means the entire index of ~2000 stocks is smaller than just one $AAPL (Apple)
5) Over the past 28 years $IWM has only had 4 double digit negative years (2002, 2008, 2018, 2022) however the combined returns of the 2 years following those negative double years is 51.5% and with $IWM currently up 14% YTD (and let's say we finish up ~20% this year) that means next year $IWM could be setting up for a +31% year which is the exact average of the 5 best years since 1995 so it's very doable.
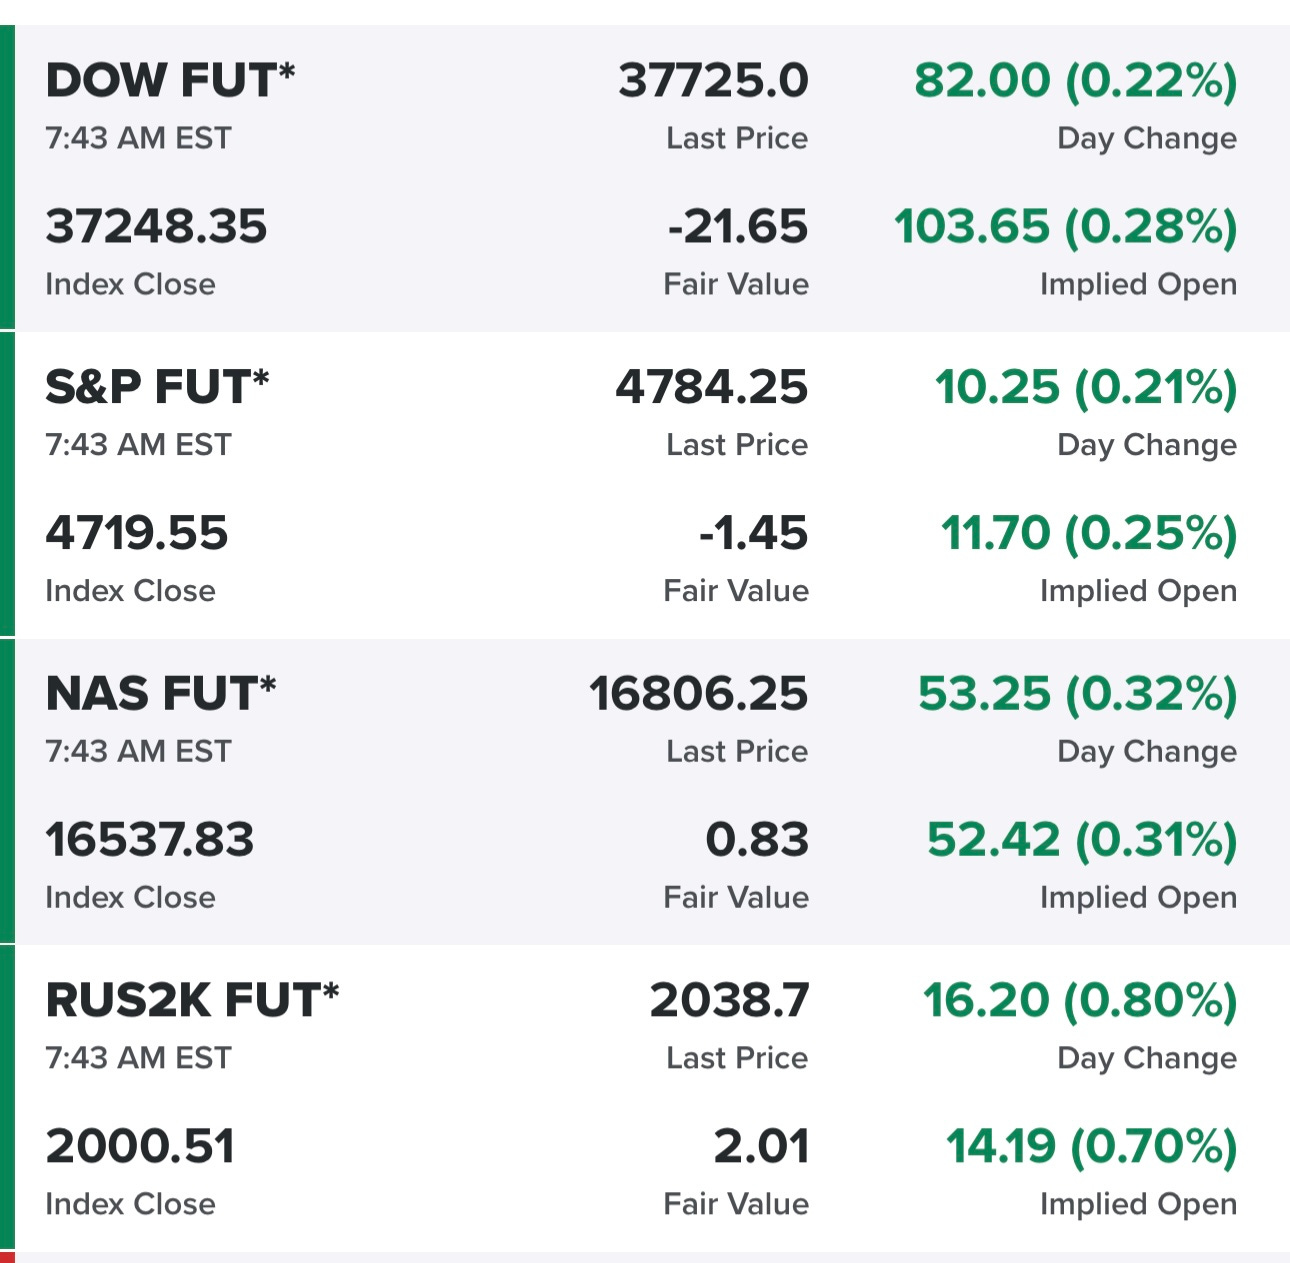
Equity futures…
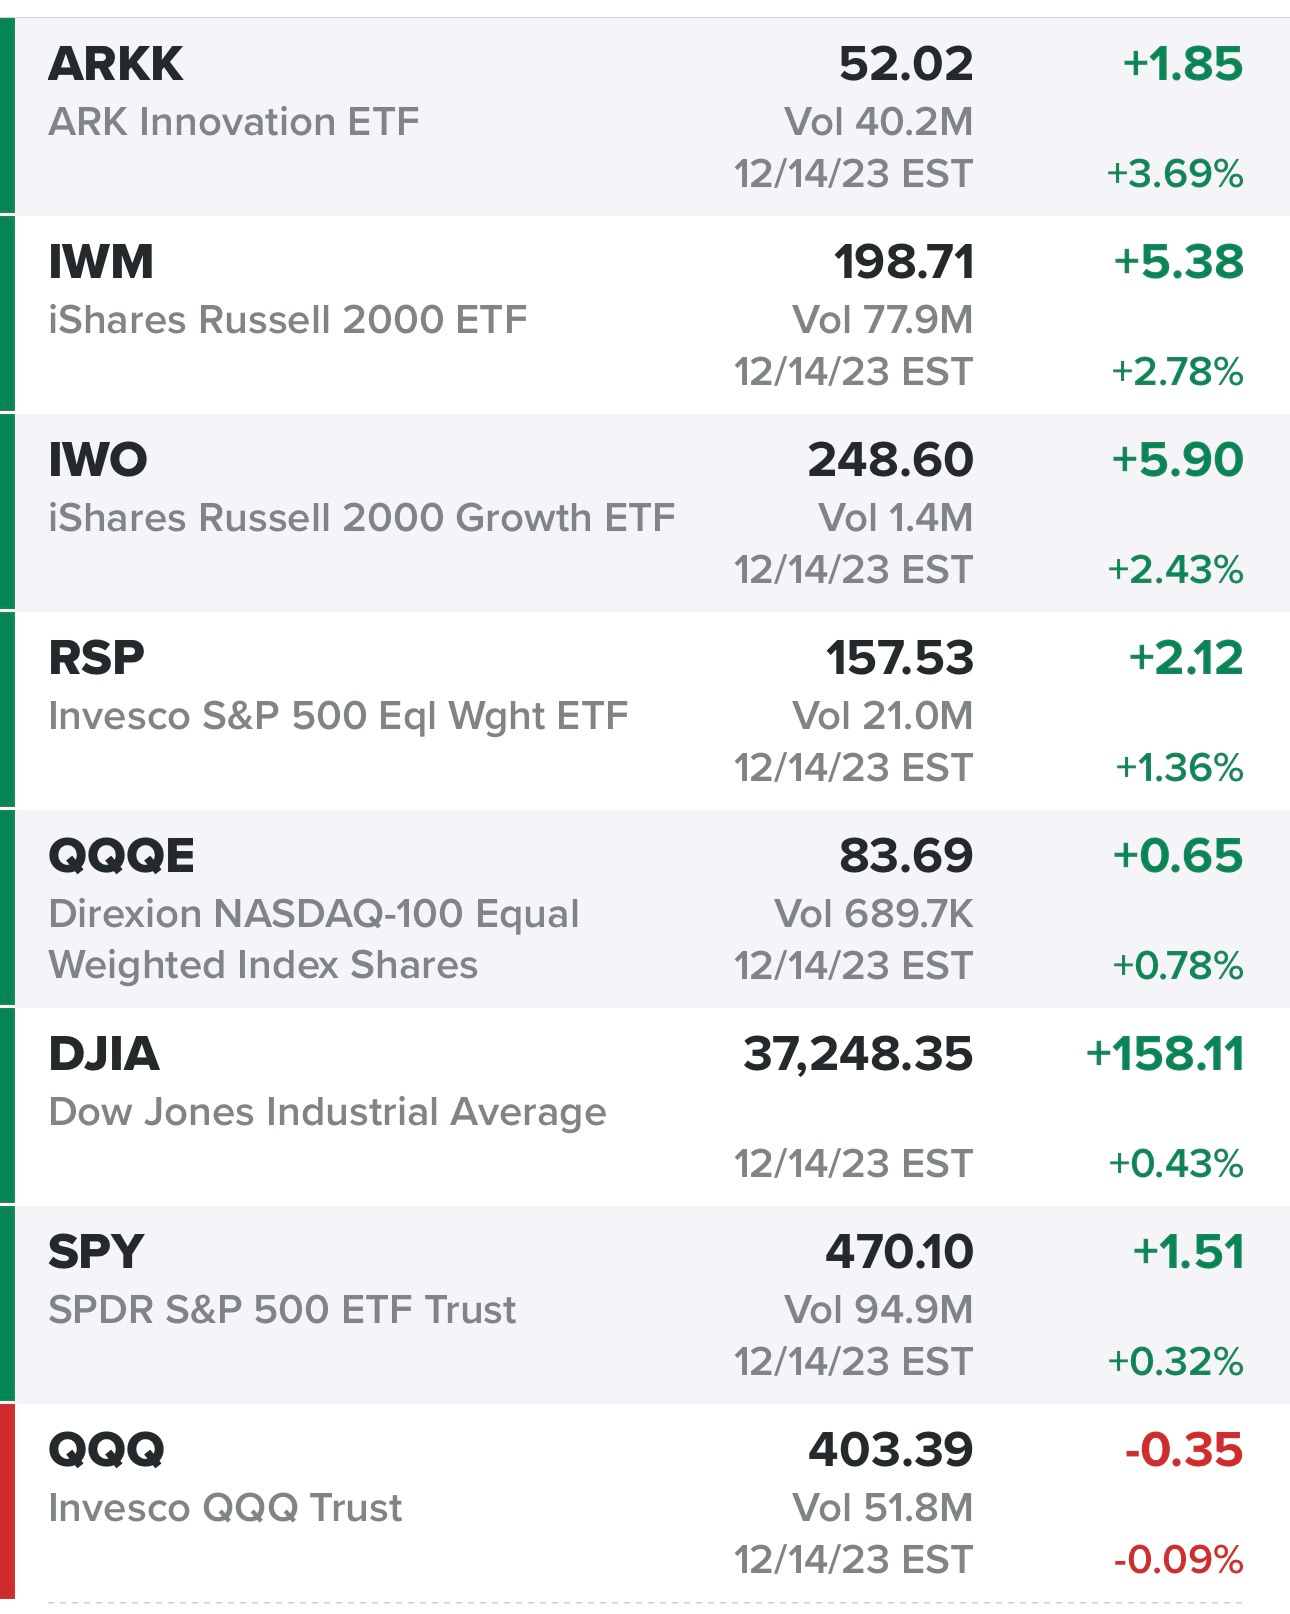
Indexes from yesterday…
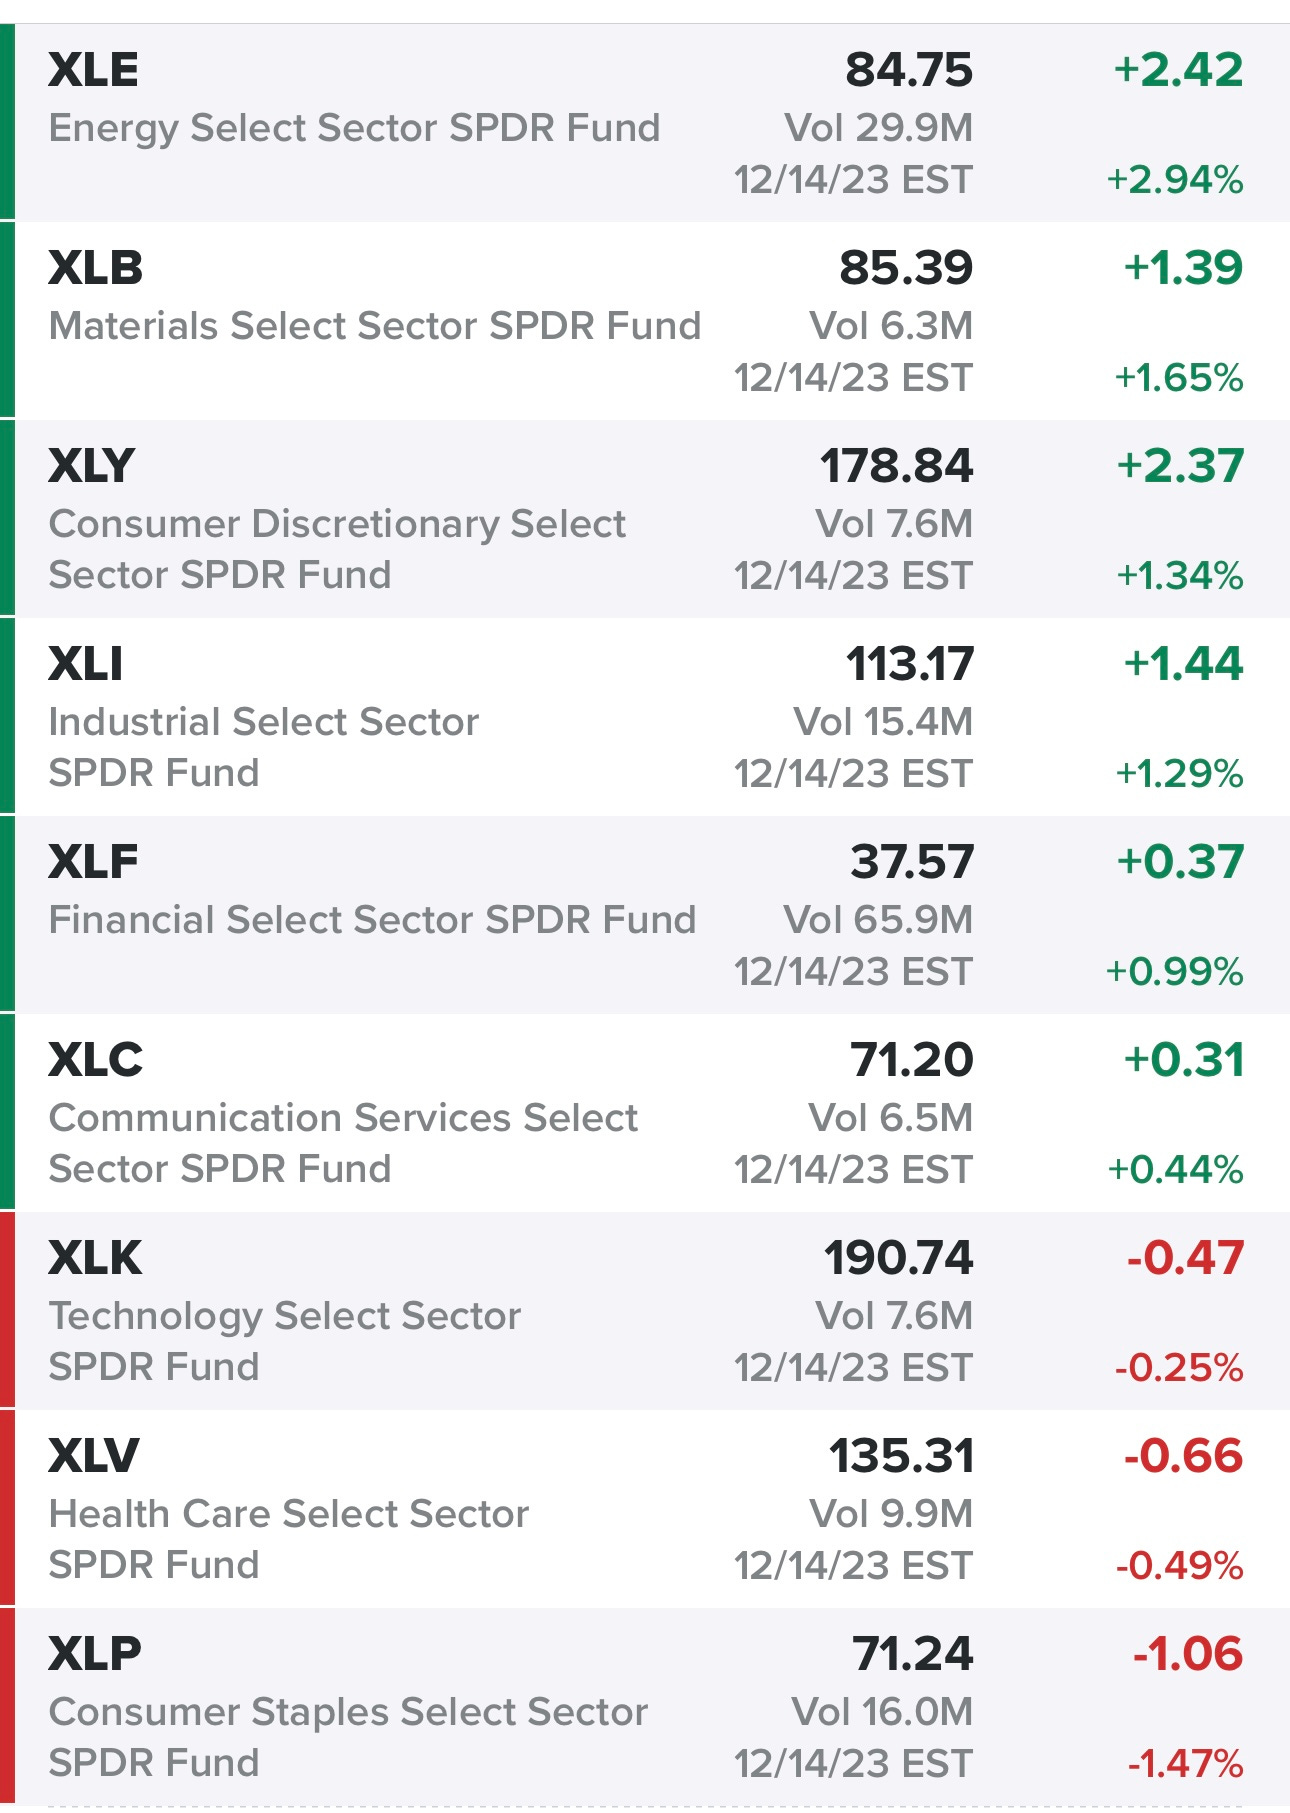
Sectors from yesterday…
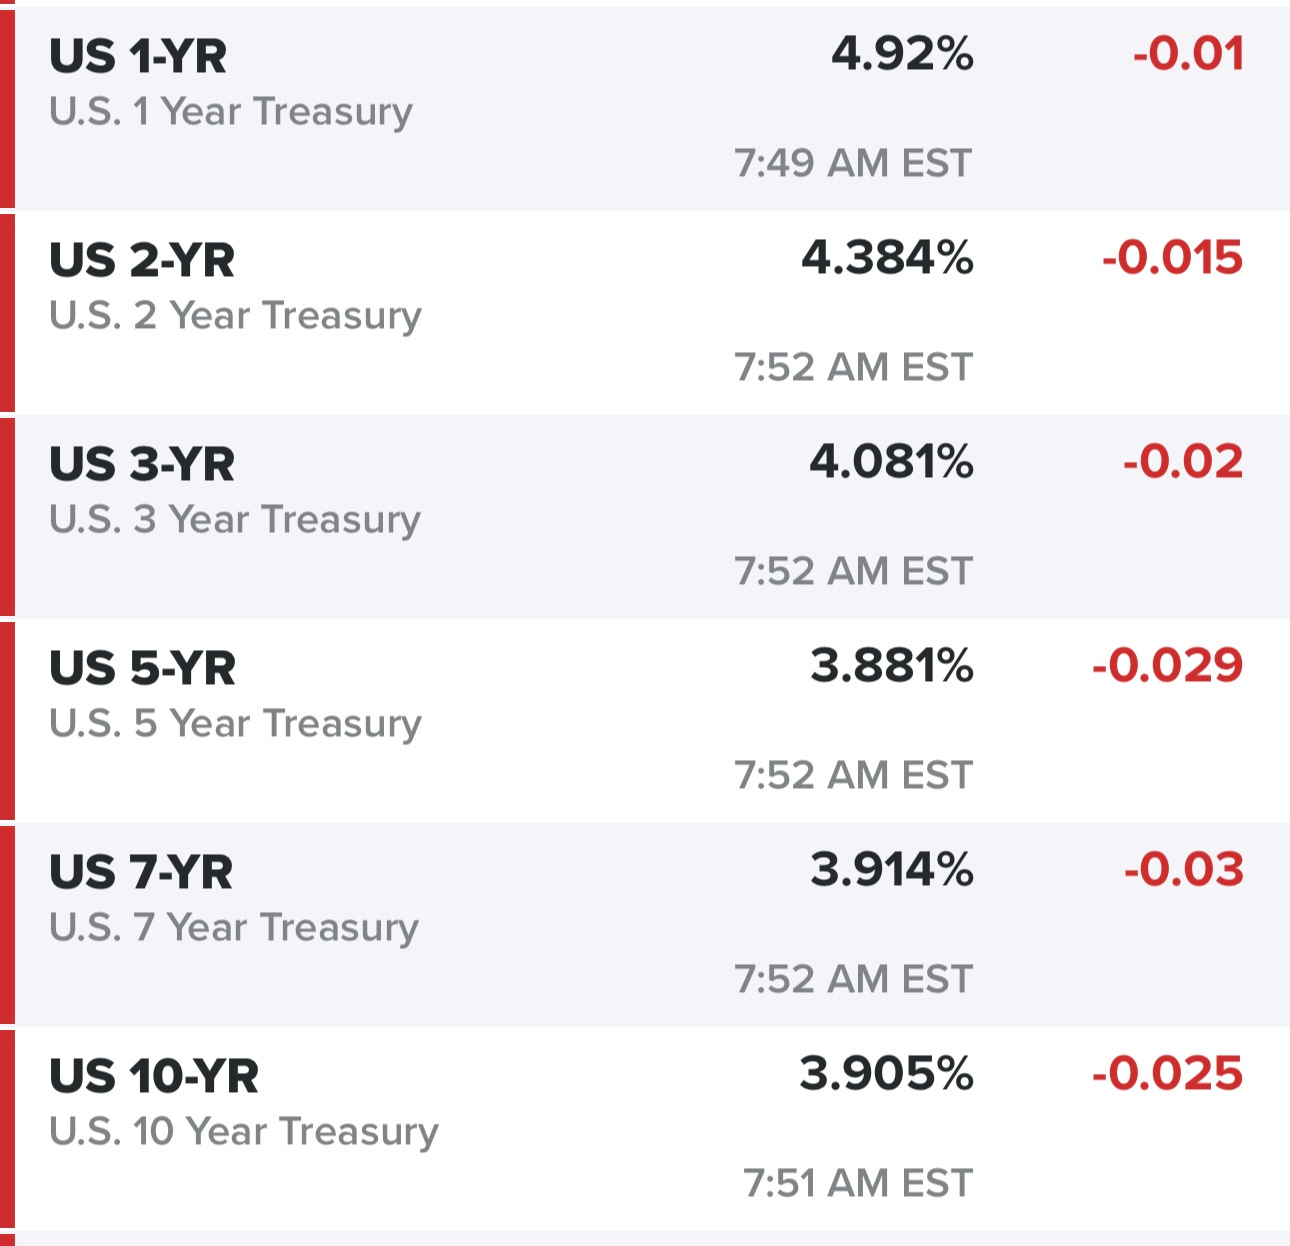
Rates…
$TNX (10Y Treasury)
$VIX
$CL1! (Oil)
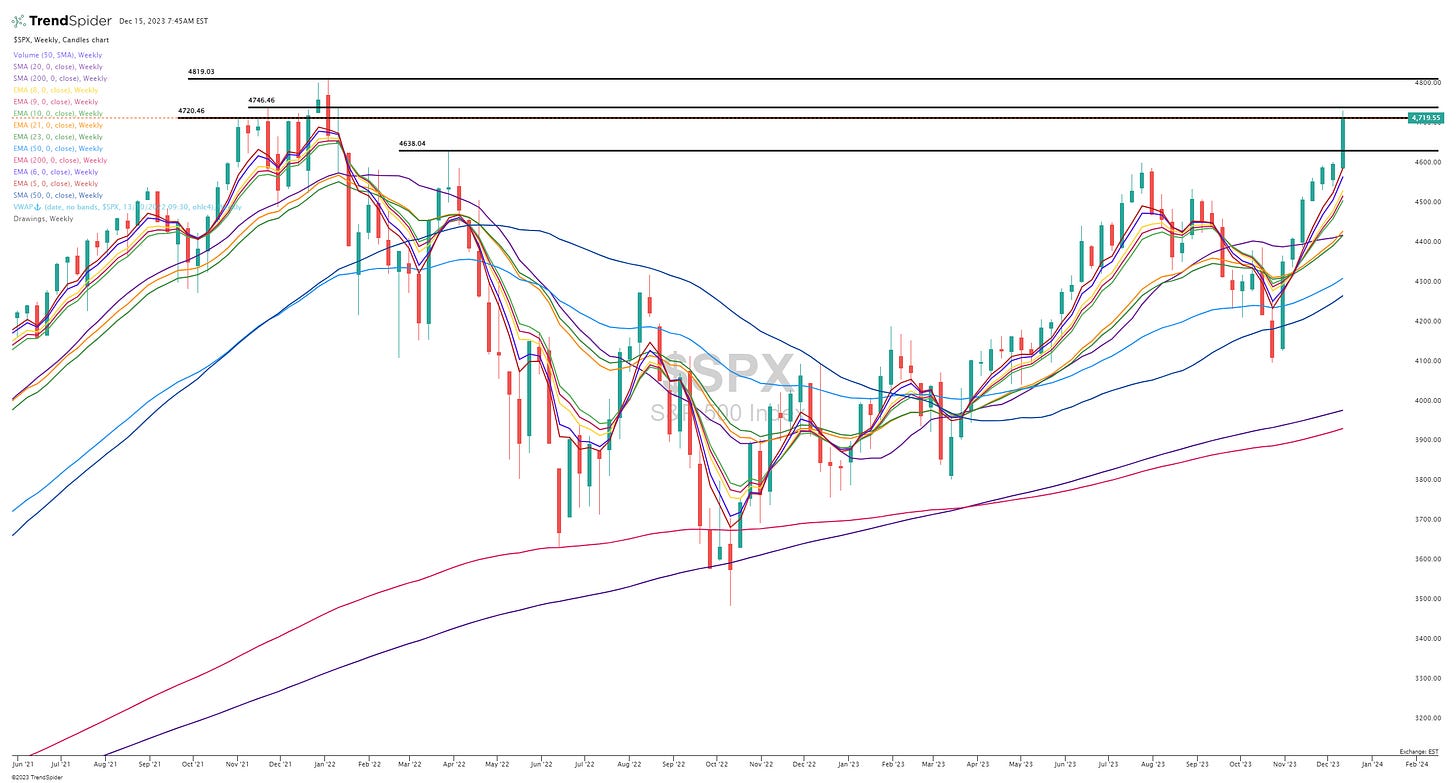
$SPX (S&P 500)
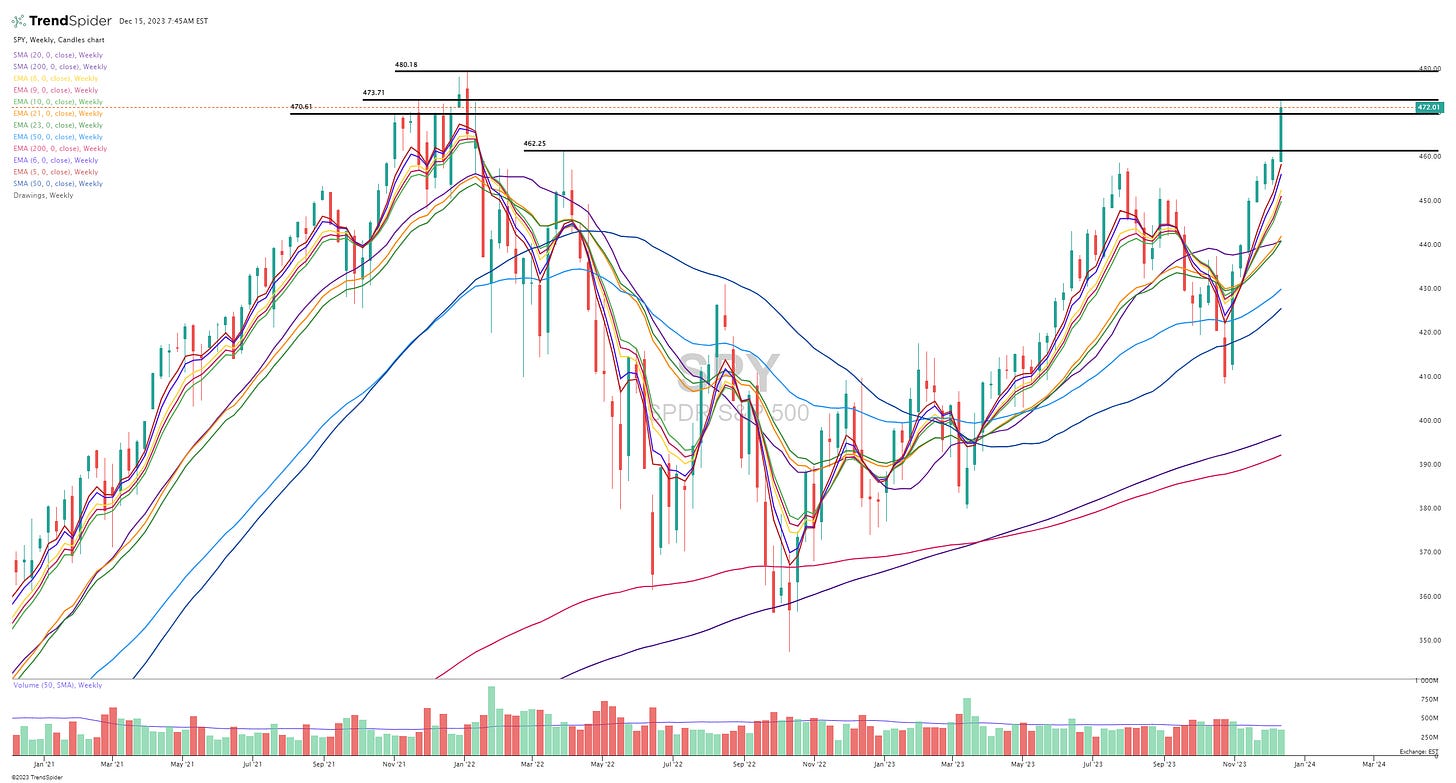
SPY (S&P 500, market cap weighted)
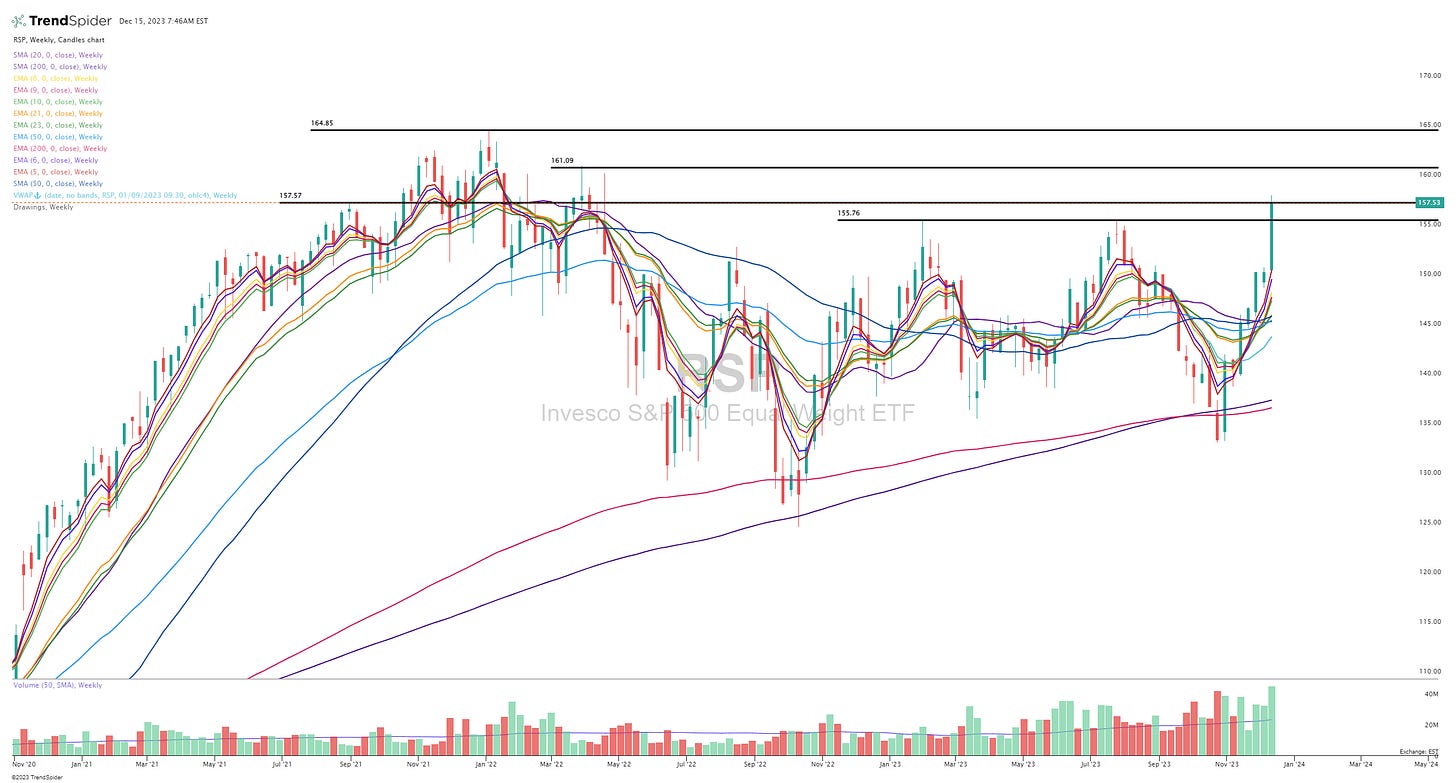
RSP (S&P 500, equal cap weighted)
QQQ (Nasdaq 100, market cap weighted)
QQQE (Nasdaq 100, equal cap weighted)
IWM (Russell 2000, small/mid caps)
IWO (Russell 2000 Growth, small/mid caps)
ARKK (Ark Innovation ETF)
Finviz screen #1: ACAD ADC AFRM AGNC ALKS ALLY ALNY ANET ANF APO APP ARCC ASAI ASB ASML ASND AX AXNX AXON AXSM AZEK AZTA BAC BBIO BBVA BIRK BK BRBR BRZE BXMT BXSL C CADE CATY CAVA CBSH CCJ CCL CFG CFR CINF CM CMA COF COLB CORT COUR CPNG CRS CRWD CWAN CYBR DASH DB DDOG DFS DKNG DT DUOL DV DXCM EDU ELF EPRT EQH ERJ ESMT EVH EWBC EXR FHN FITB FLNC FLS FMX FNB FOLD FOUR FROG FRPT FTAI GBCI GEN GLBE GS GTLB HASI HBAN HDB HL HOOD HUBS HWC IBN IMGN ING IONQ IOT ITCI ITUB JPM KEY KGC KKR KNF LNTH LW LYV MANH MARA MDB META MMYT MNDY MRTX MS MTB MUFG NARI NBIX NCLH NEOG NET NLY NOW NTRA NTRS NU NVDA NYCB O OBDC OKTA OLK ONB ONON OSK OTEX OZK PAAS PANW PATH PB PCAR PCOR PDD PGNY PNC PNFP POST PSN PWR RBA RBLX RCI RCL REXR RF RITM RIVN ROIV ROK RRX RY RYAAY S SDRL SGEN SHOP SMAR SMFG SN SNOW SNPS SNV SOFI SPT SQ SSB STNE STT STWD SYF SYM TAL TCBI TD TEAM TFC TREX TTD U UBS UBSI UCBI URI USB VICI VLY VOYA WAB WAL WBS WFC WING WTFC XP XYL ZION ZS
Criteria: price above $5, market cap above $3B, above 50d sma, above 200d sma, average volume above 400k, QoQ sales growth above 20%
Below the paywall is my:
daily watchlists with charts
link to current trading portfolio including all positions (open & closed), entry prices and stop losses
links to my daily webcast and all previous webcasts
YTD performance


