


Trading the Charts for Monday, August 14th

In order to read this entire newsletter which includes full access to my trading portfolio (up ~66% YTD), daily watchlist, daily activity (buys, sells, entry prices, stop losses, performance) and my daily webcasts you’ll need to become a paid subscriber by clicking the button below.
I also run a Stocktwits rooms where I post about my investment portfolio (up ~98% YTD and ~1,000% over the past 3-years) with full access to all holdings, performance, daily activity, market commentary, quarterly earnings analysis, daily webcasts and more.
Here are my deep dive newsletters…

Good morning and Happy Monday,
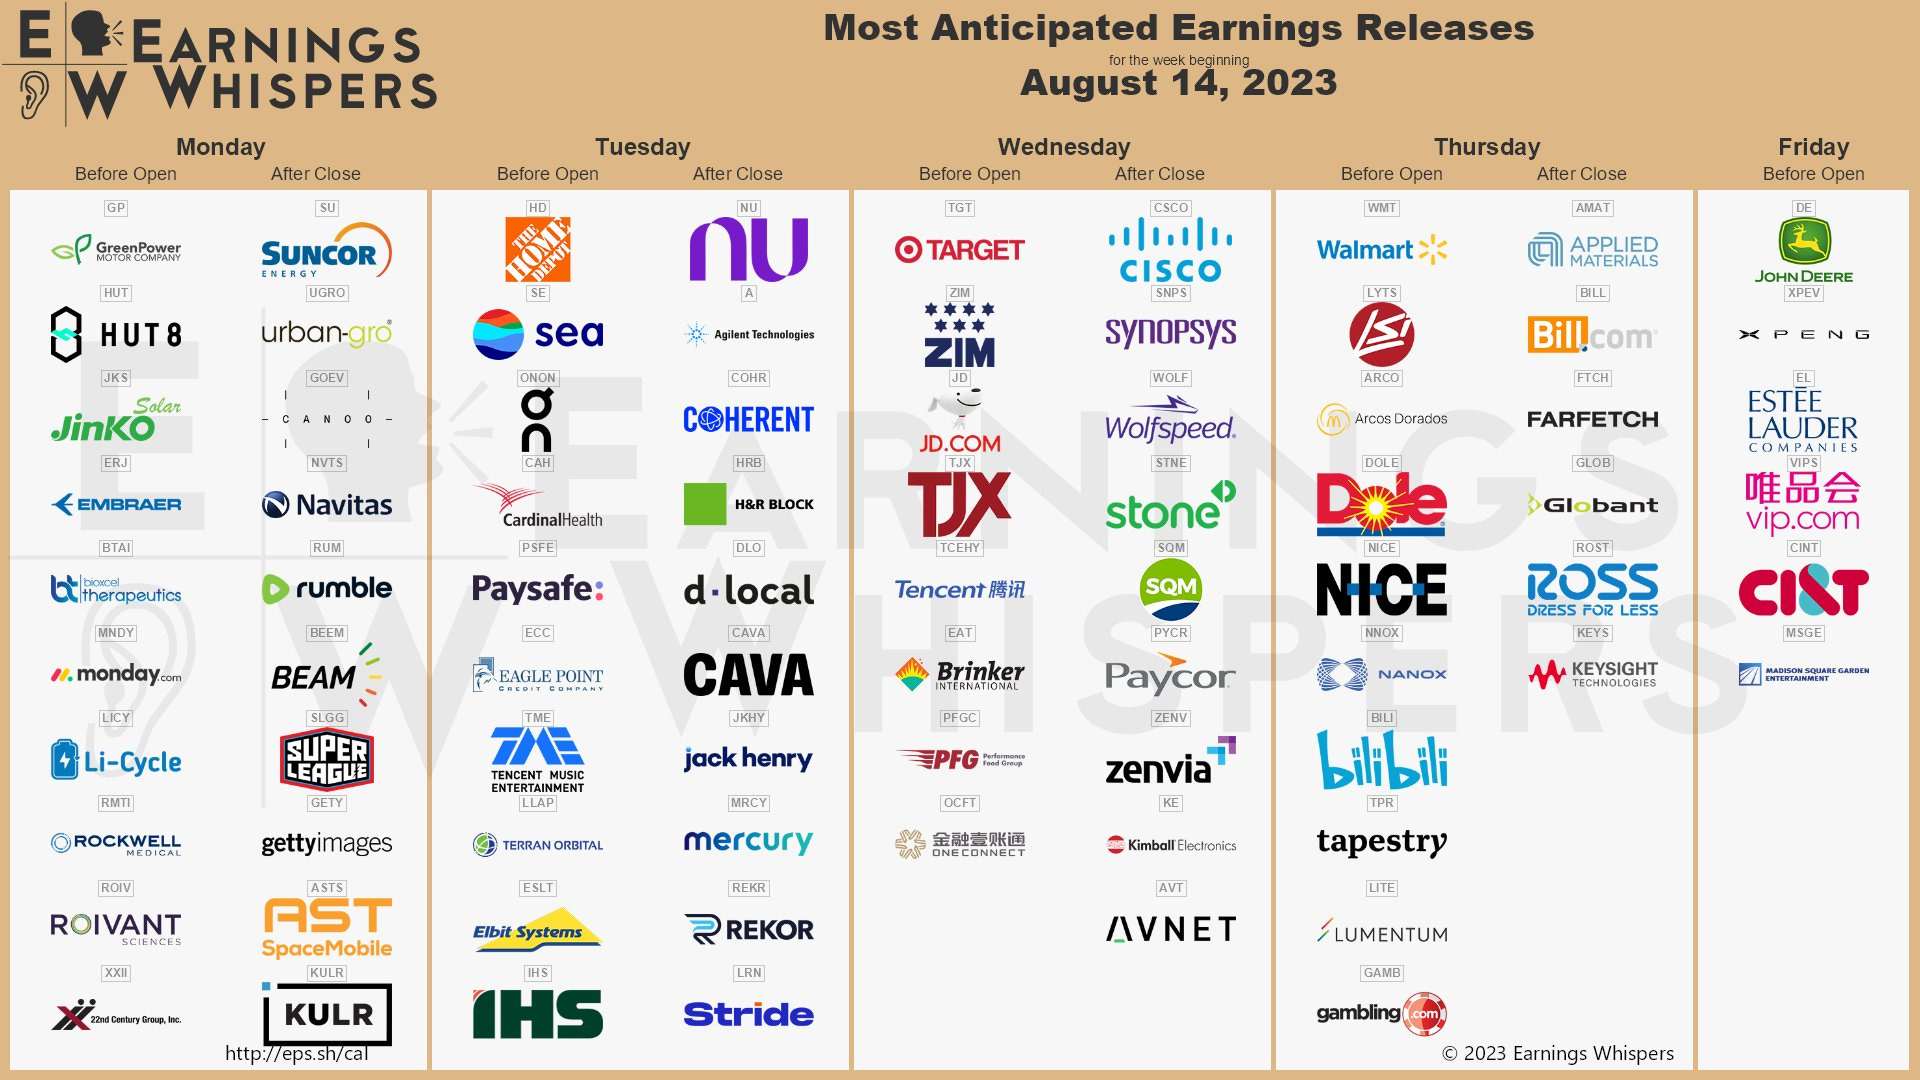
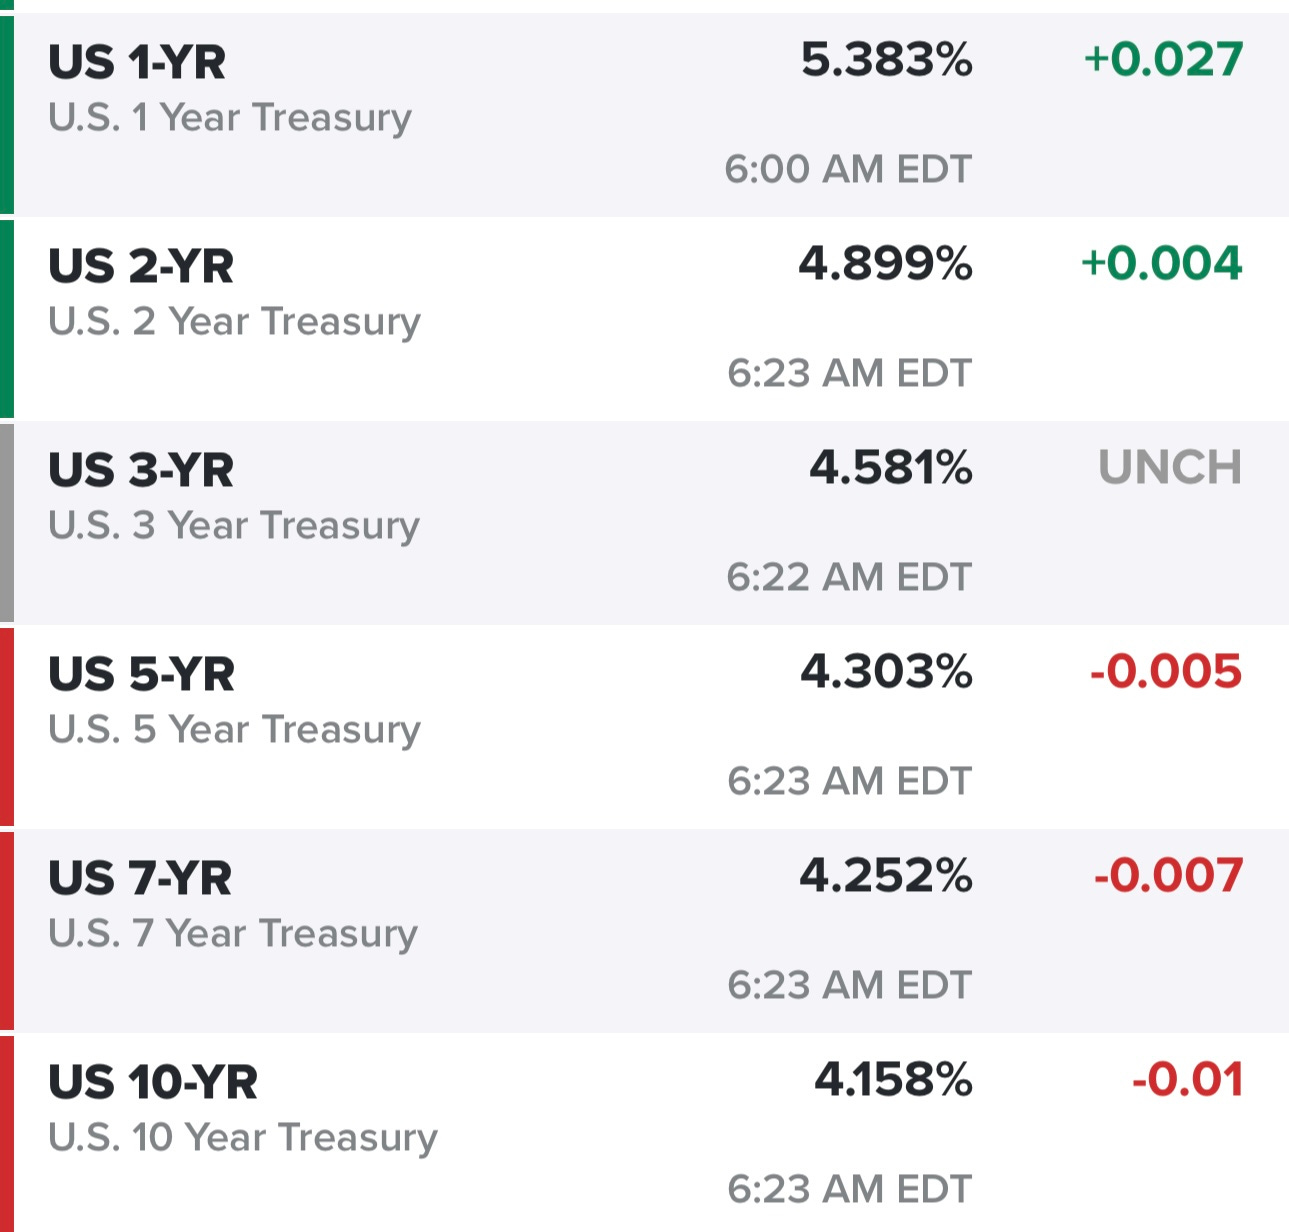
We’re through the heart of earnings season but we still have a few more companies reporting this week including the largest retailers on the planet. Markets coming off a down week that included lots earnings and macro so this week is looking a little calmer however we still need to worry about yields with the 10Y back to 4.15%
I went through 400+ charts last night and found dozens that look great coming into today but very few of them are in tech, semis, growth and/or small/mid cap. Right now the best looking charts are in energy, financials and industrials. If you’re a long term investor there’s nothing wrong with adding to your favorite growth names as they pullback to their 50/100d moving average but if you’re trading you need to be focusing on what’s working right now and it’s mostly cyclicals in traditional value sectors. With the 10Y at 4.15% the market is rewarding the companies with strong earnings growth, high FCF yields and low SBC.
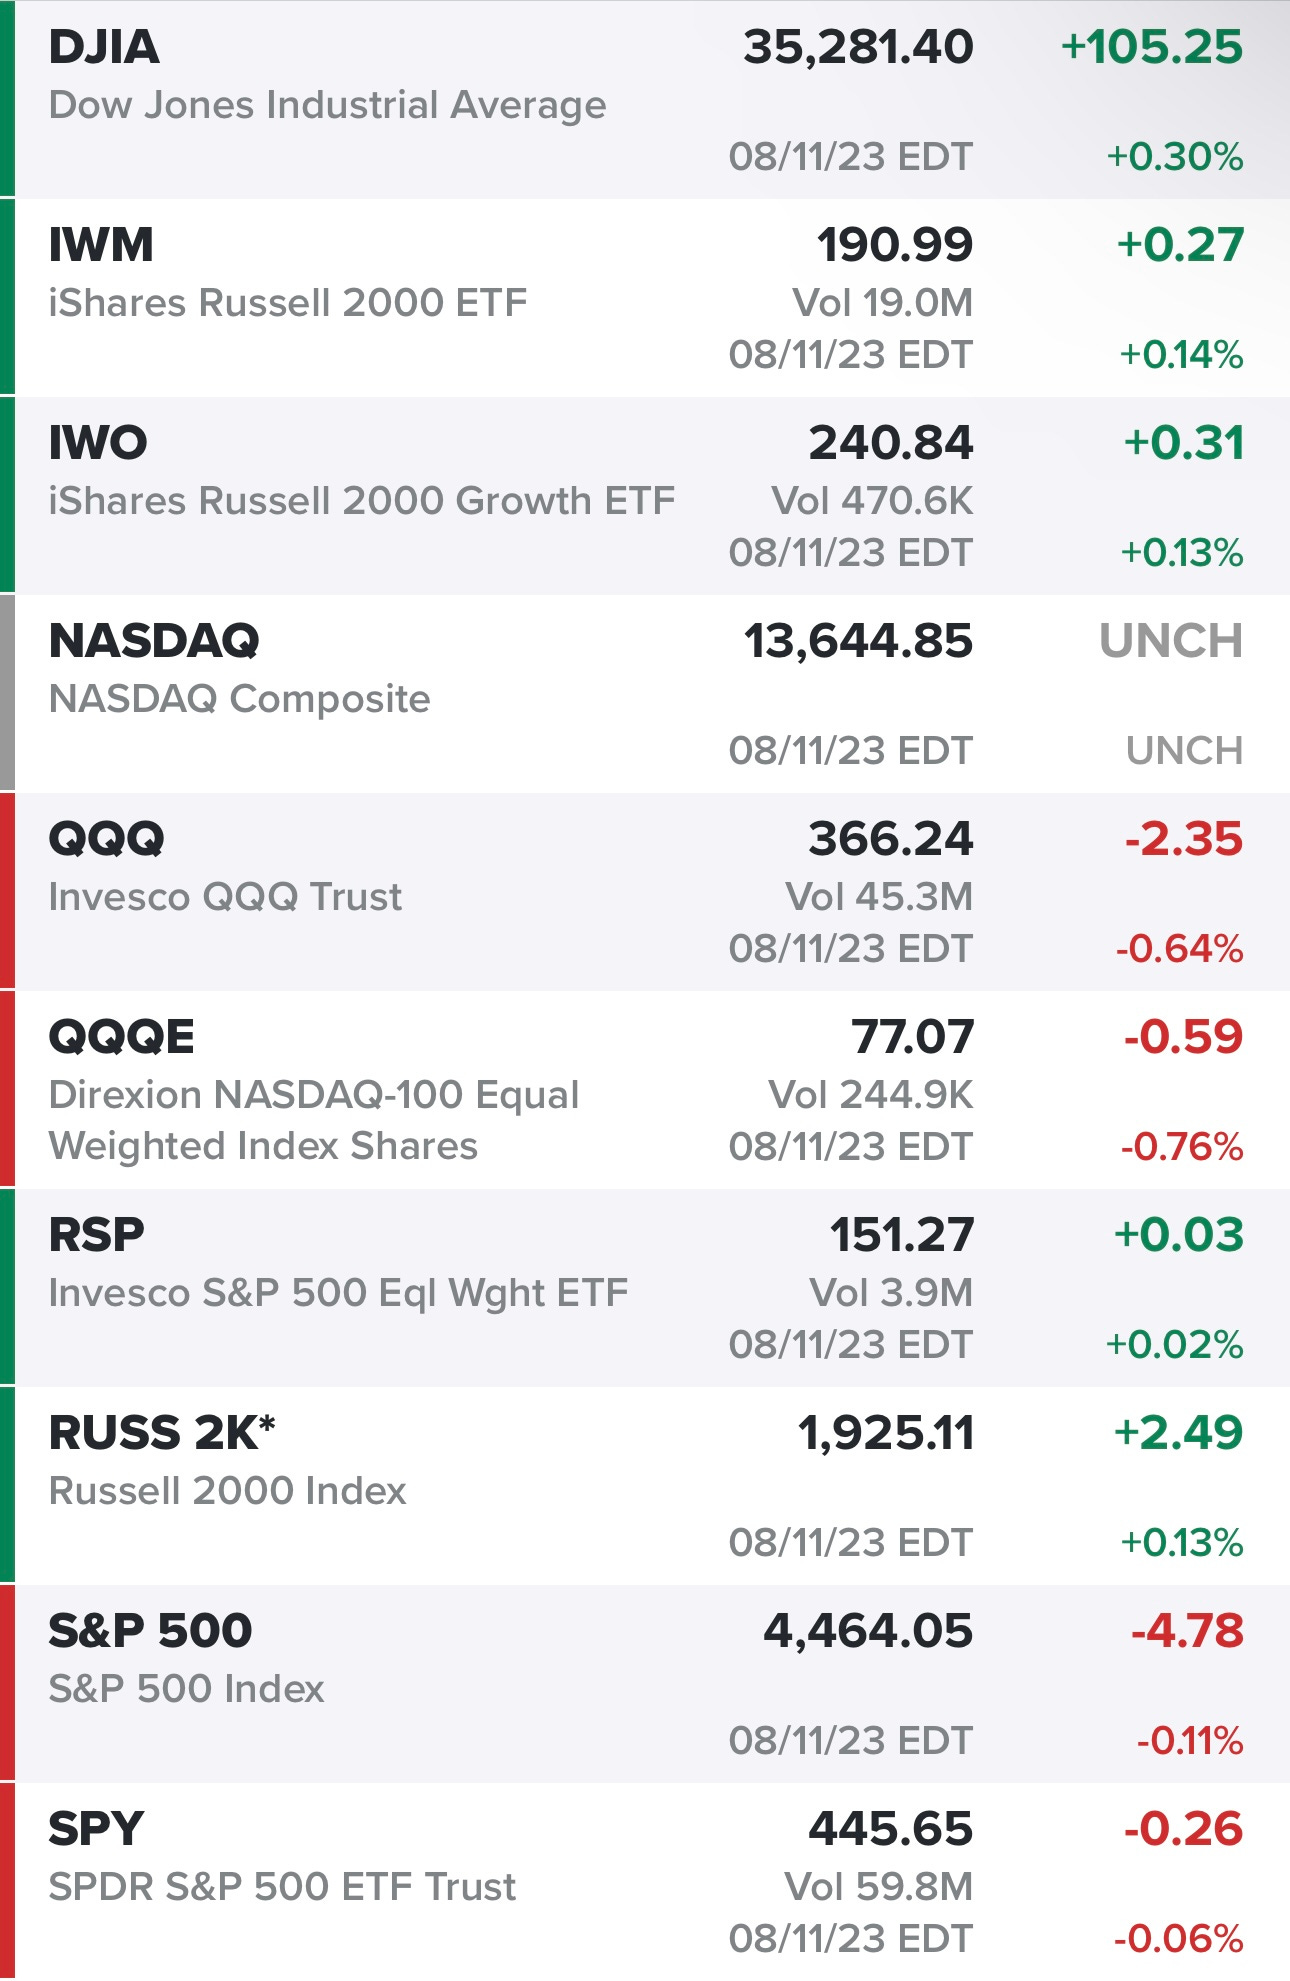
Markets coming off a mixed day on Friday with the Dow Jones doing the best…
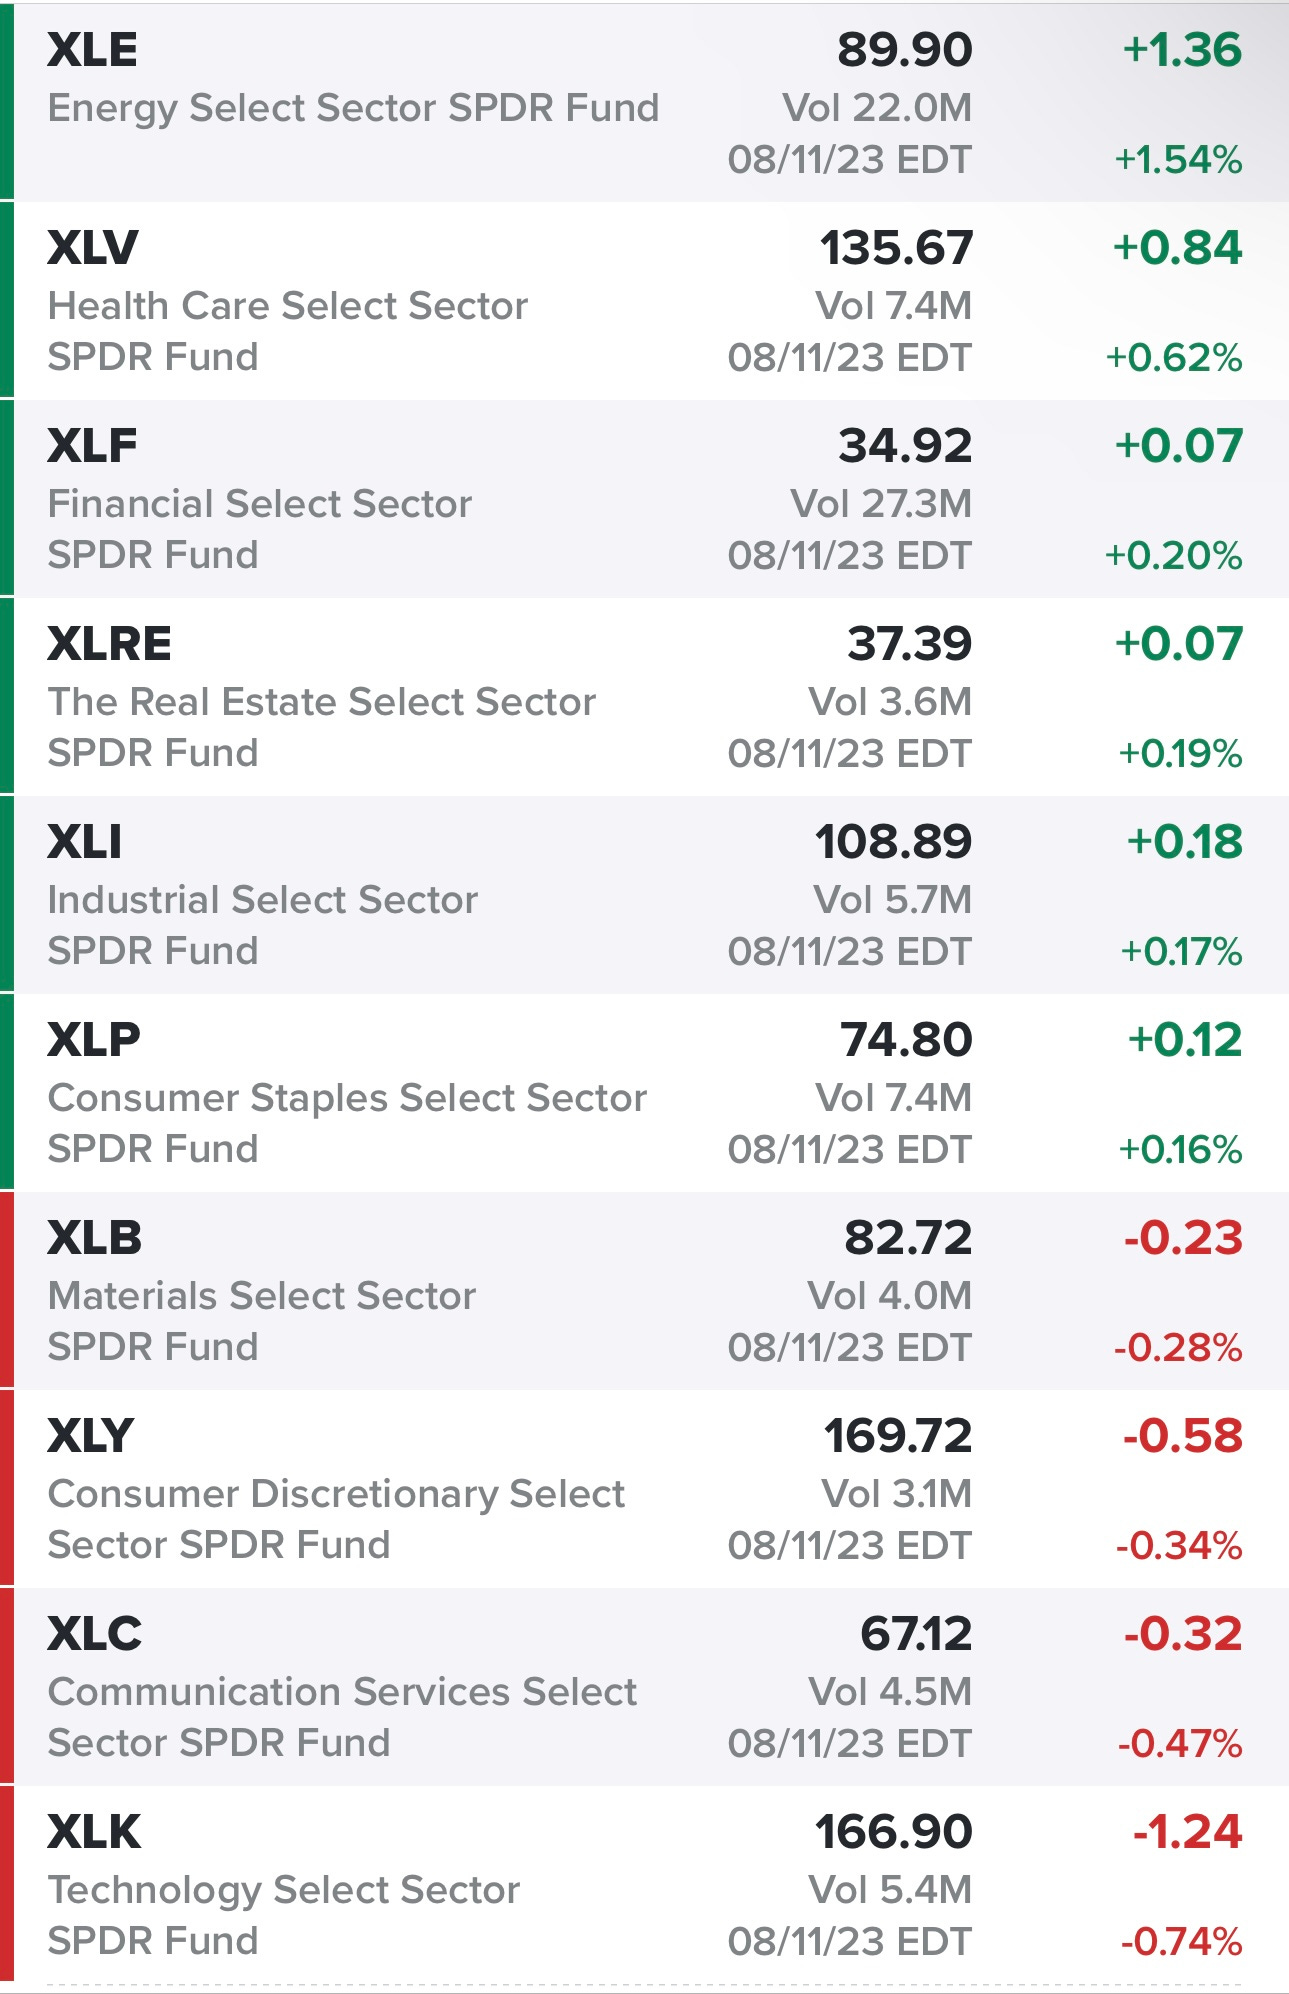
Energy continues to be the strongest sector, it has been for the past month…
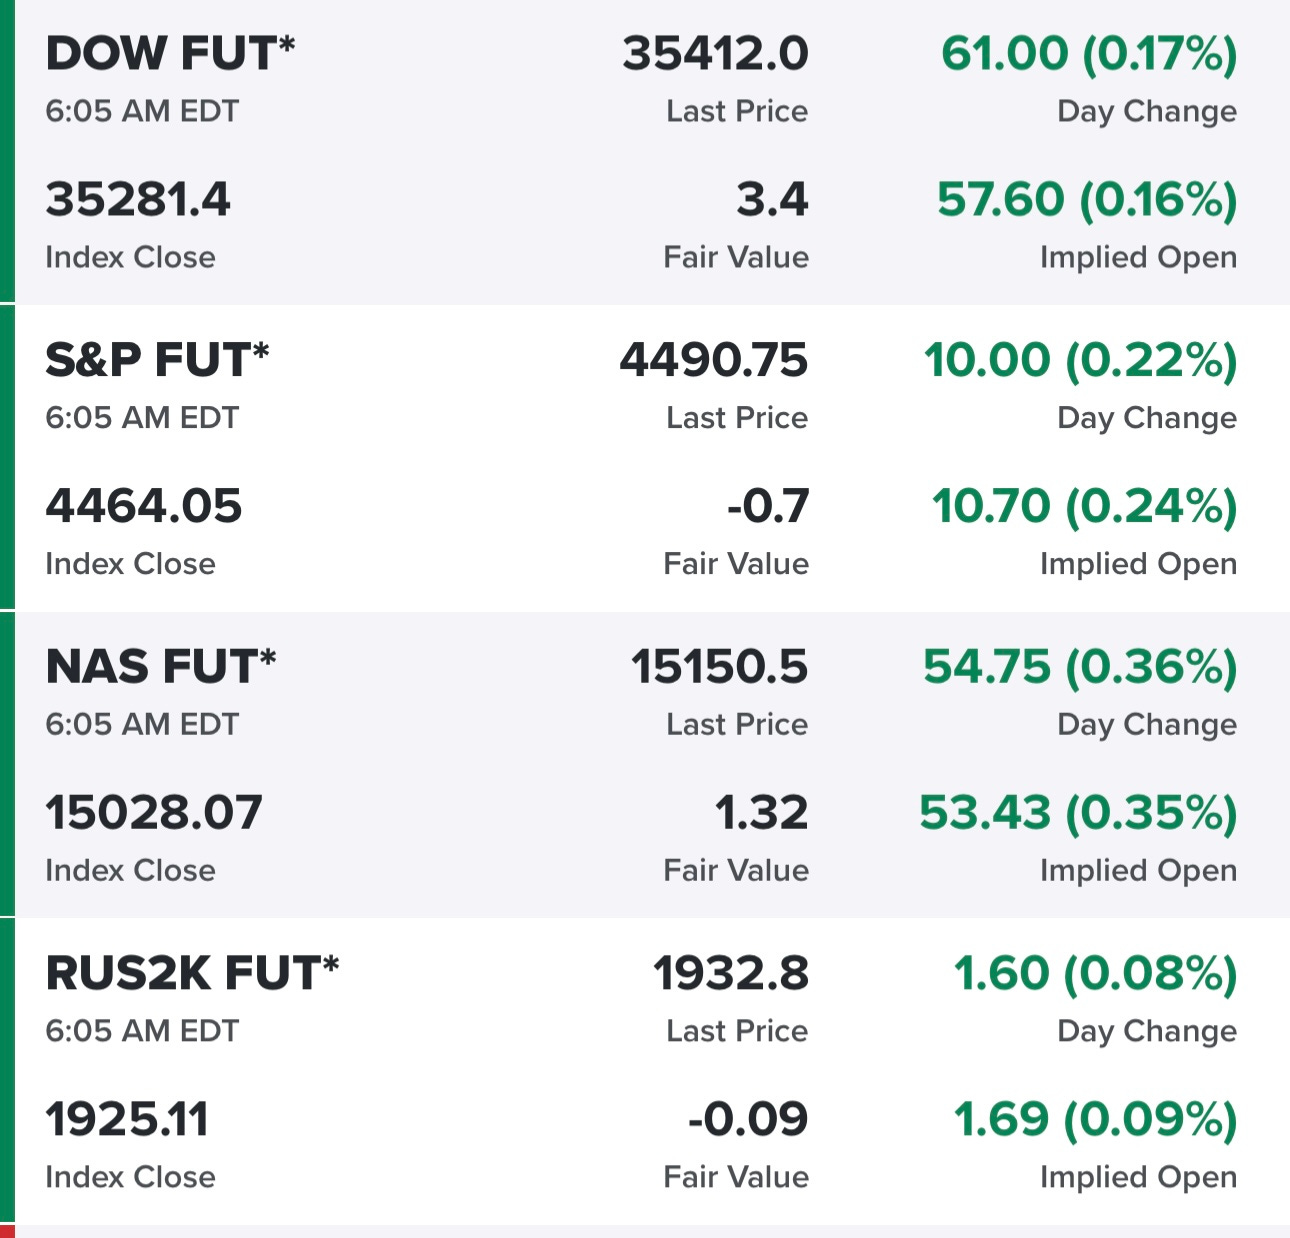
Futures looking decent this morning…
Yields flat this morning but higher than a week ago…
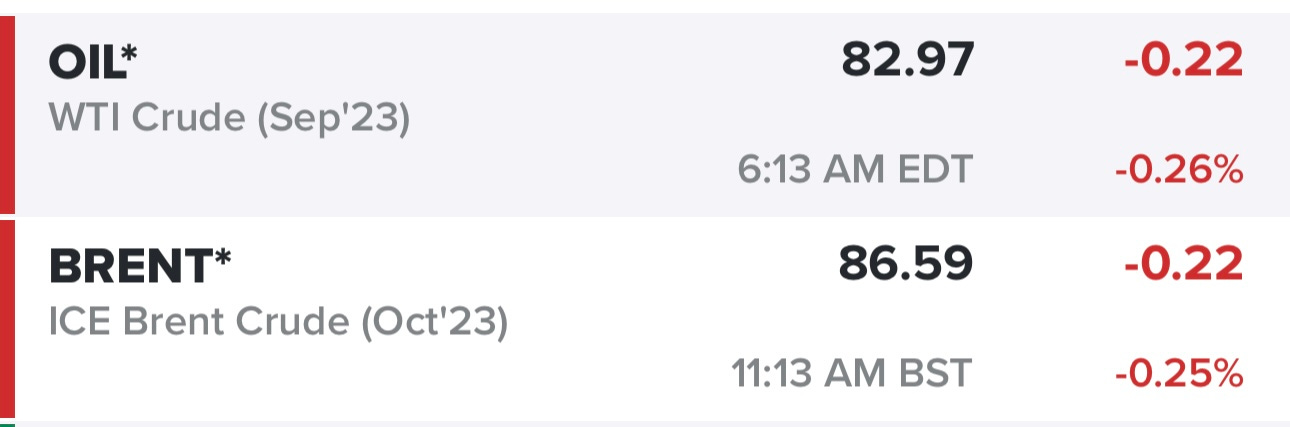
Oil still hovering around $83…
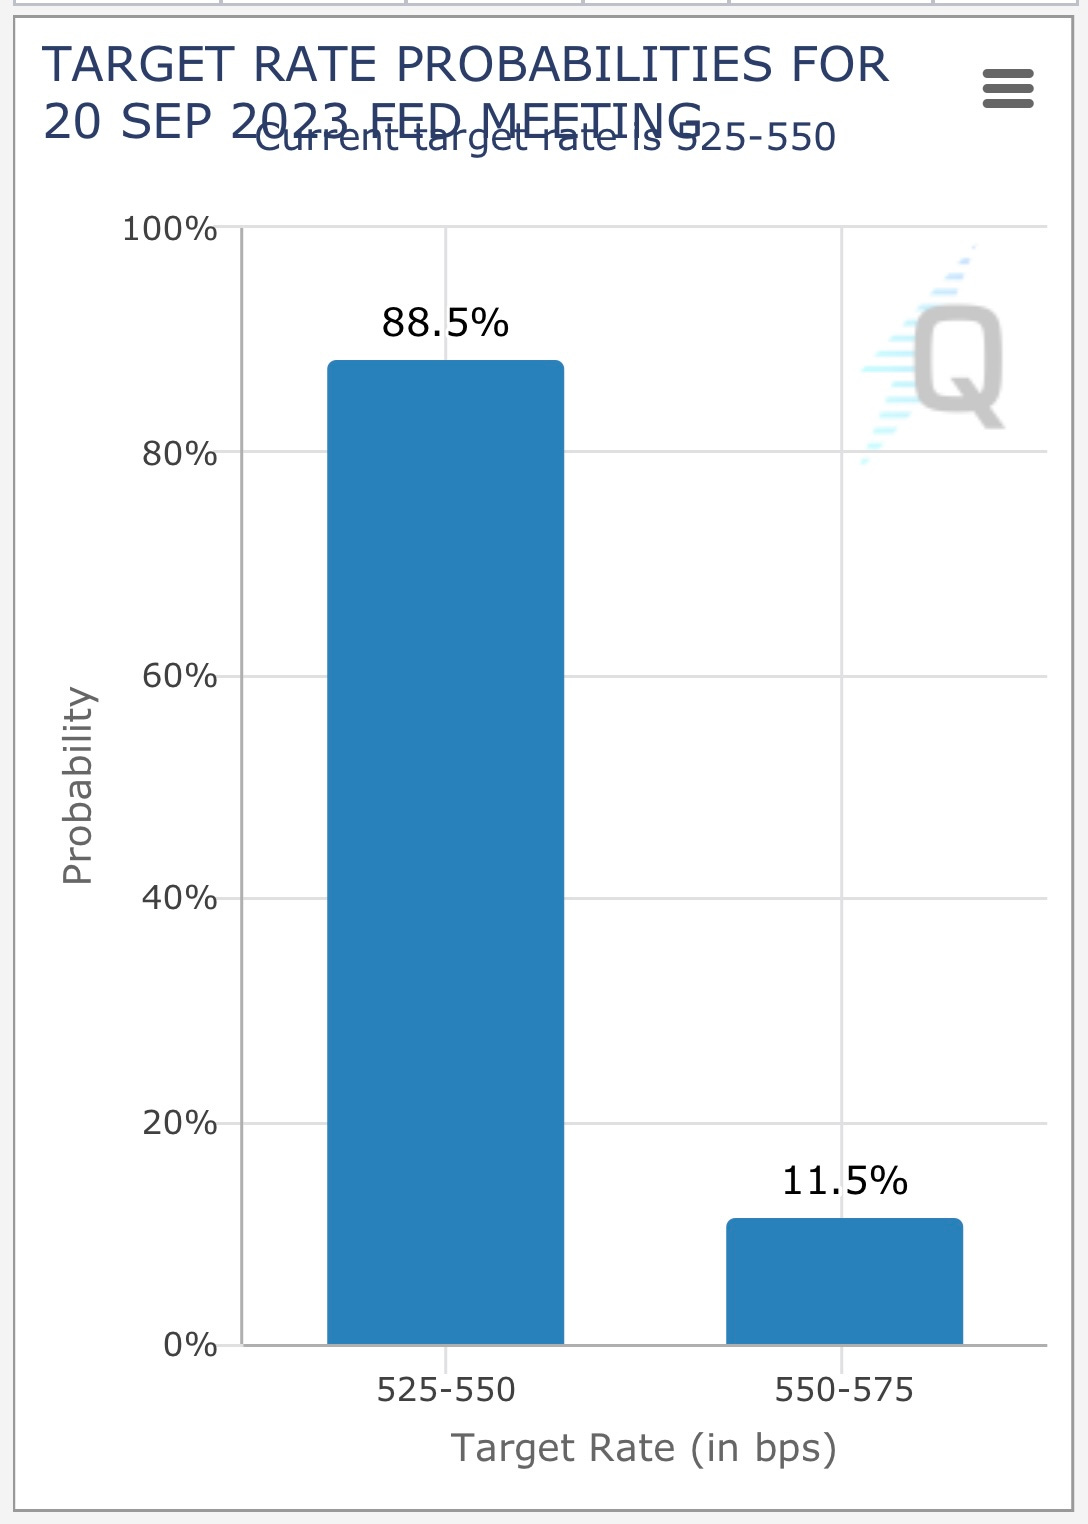
There’s no FOMC meeting in August with the probability of a September rate hike now down to 11.5%
SPY down -3.0% from recent high but certainly looks like a mini correction, finding support on Friday at the June pivot, just above 50d sma.

RSP down -2.9% from recent high, bounced just above the June pivot with 50d ema just below.

QQQ down -5.6% from recent high, sliced through the June pivot, found support on Friday at 50d ema

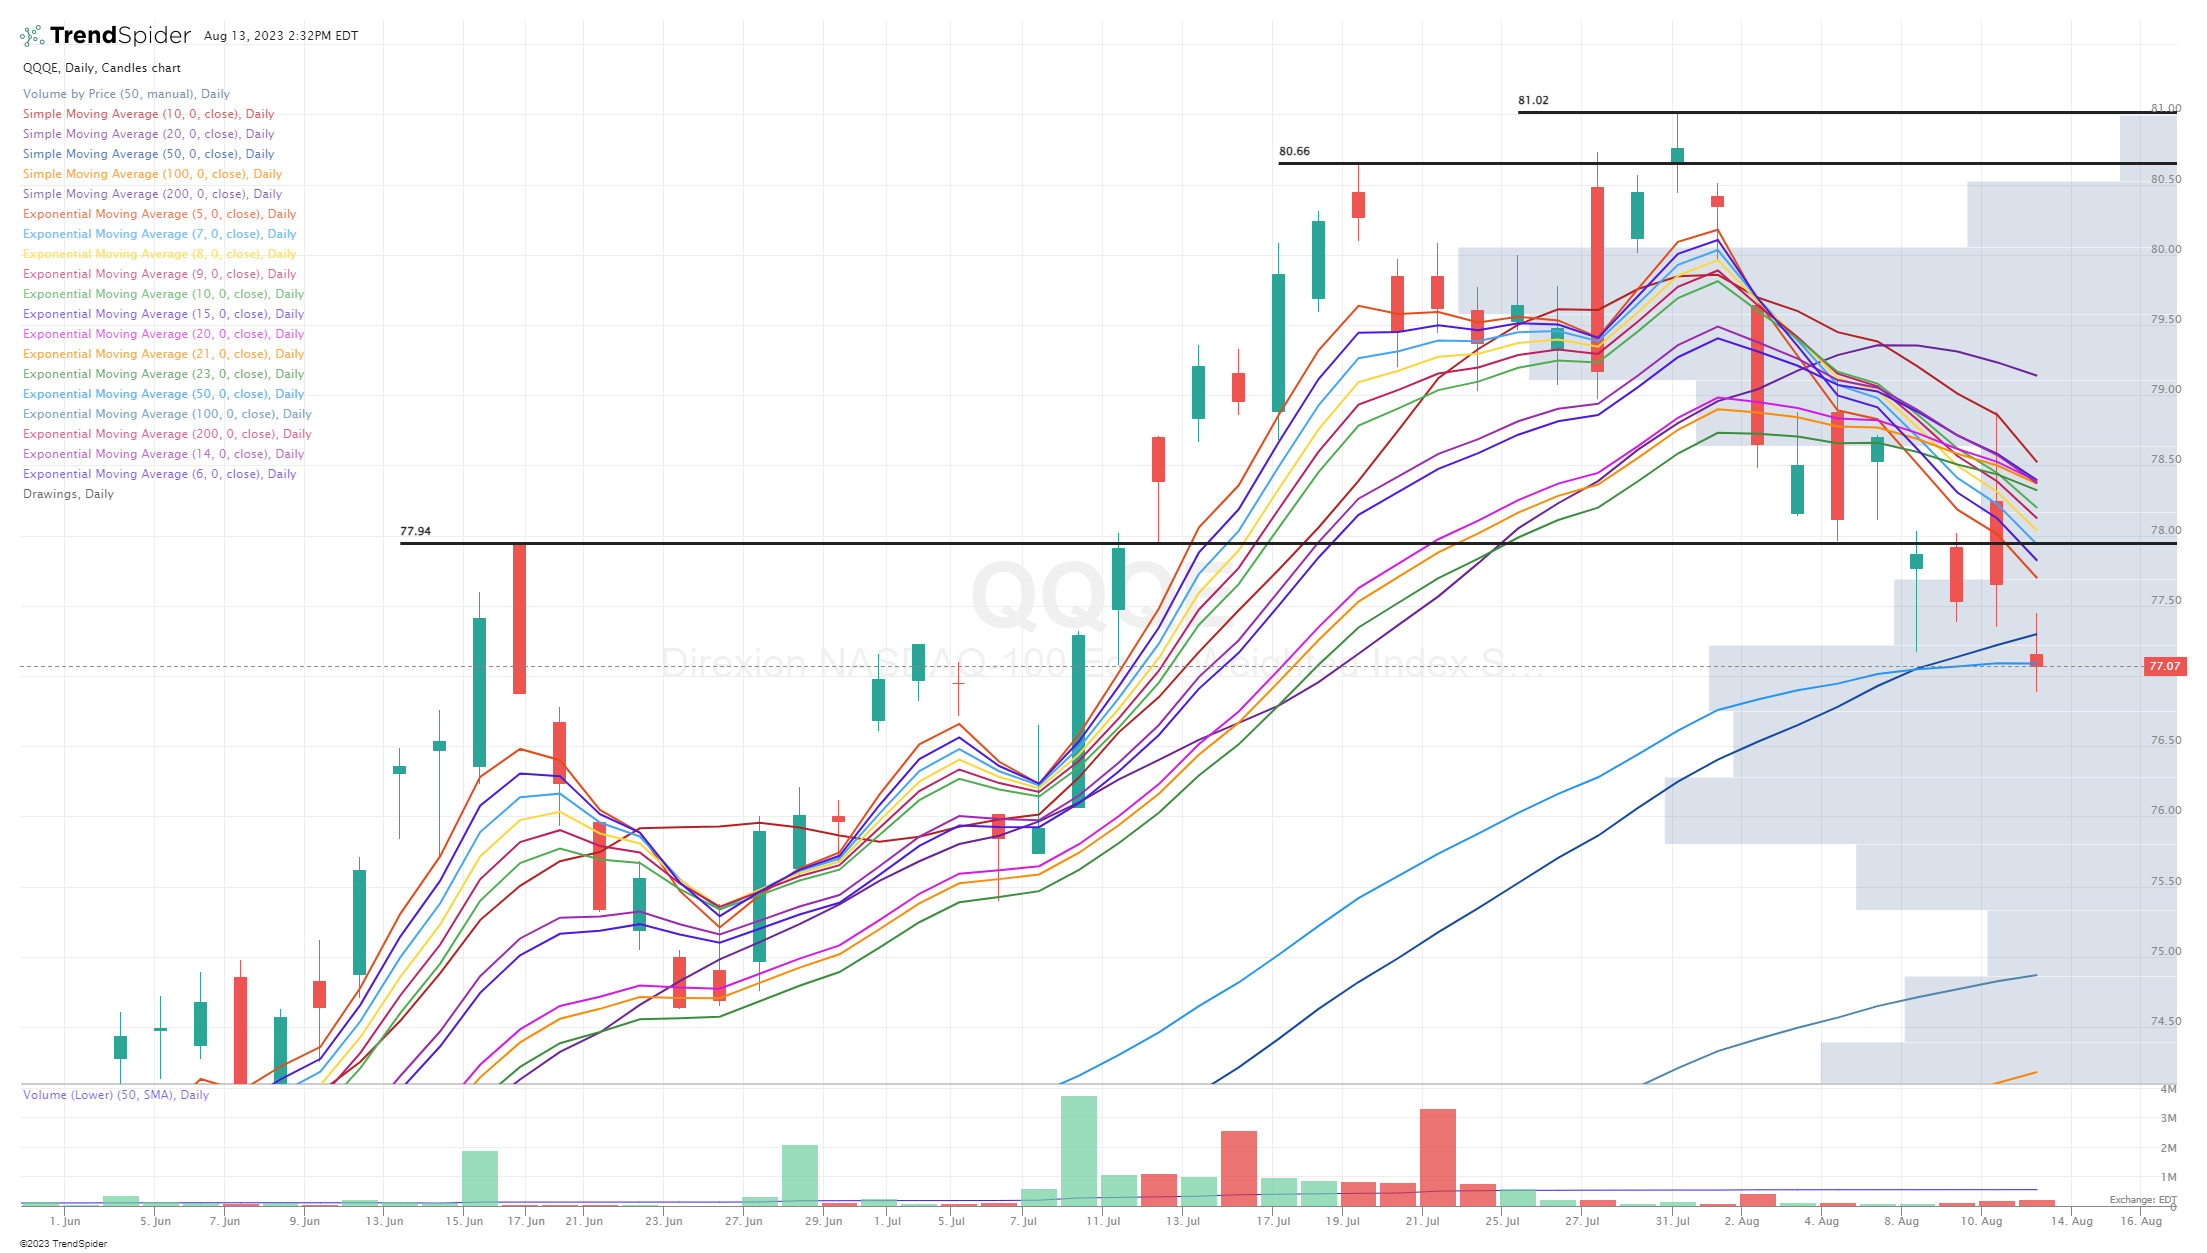
QQQE down -4.8% from recent high, sliced through June pivot last week, now trying to hang onto the 50d ema
IWM down -3.9% from recent high, bounced on Friday just above June pivot and the 50d ema/sma

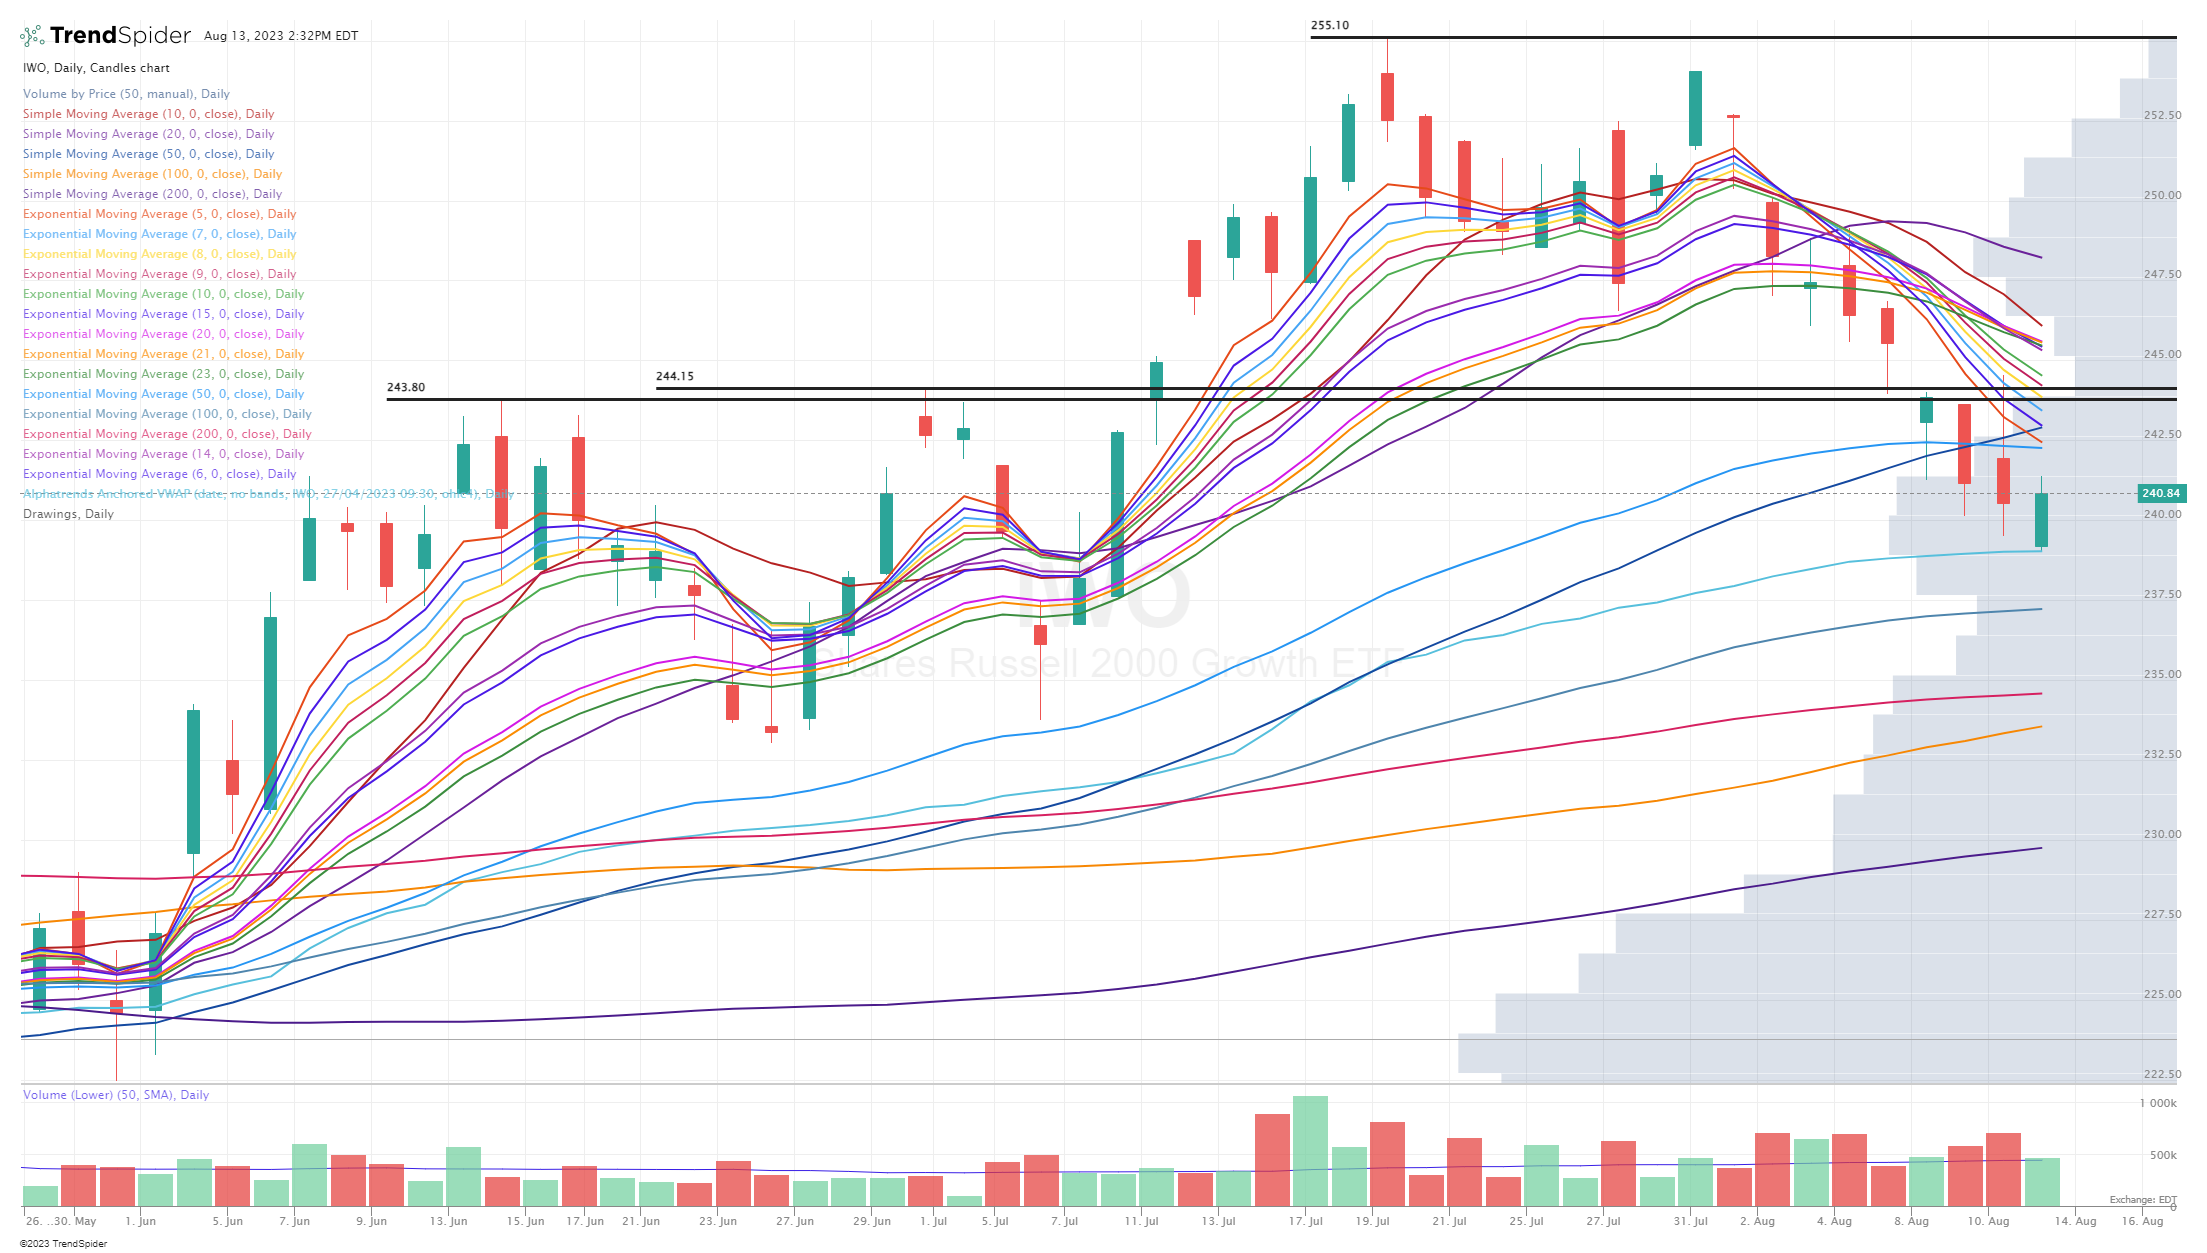
IWO down -5.6% from recent high, bounced off a VWAP from the April lows with the 100d ema just below, sliced though 50d ema/sma last week
ARKK down -16.7% from recent high or 3x more than IWO and QQQ, ARKK slicing through all kinds of support last week including the 50d ema/sma and the 200d ema plus a bunch of VWAPs, getting back above the 200d ema would be a good start, I’ve been shorting ARKK the past few weeks as it rolled off and picked up momentum to the downside so it’s been a great hedge for me.

SMH (semis) looking very ugly last week, finally losing the May pivot and 50d ema/sma, now getting into short-term oversold territory so we could see a bounce back this week which would be good for growth stocks.

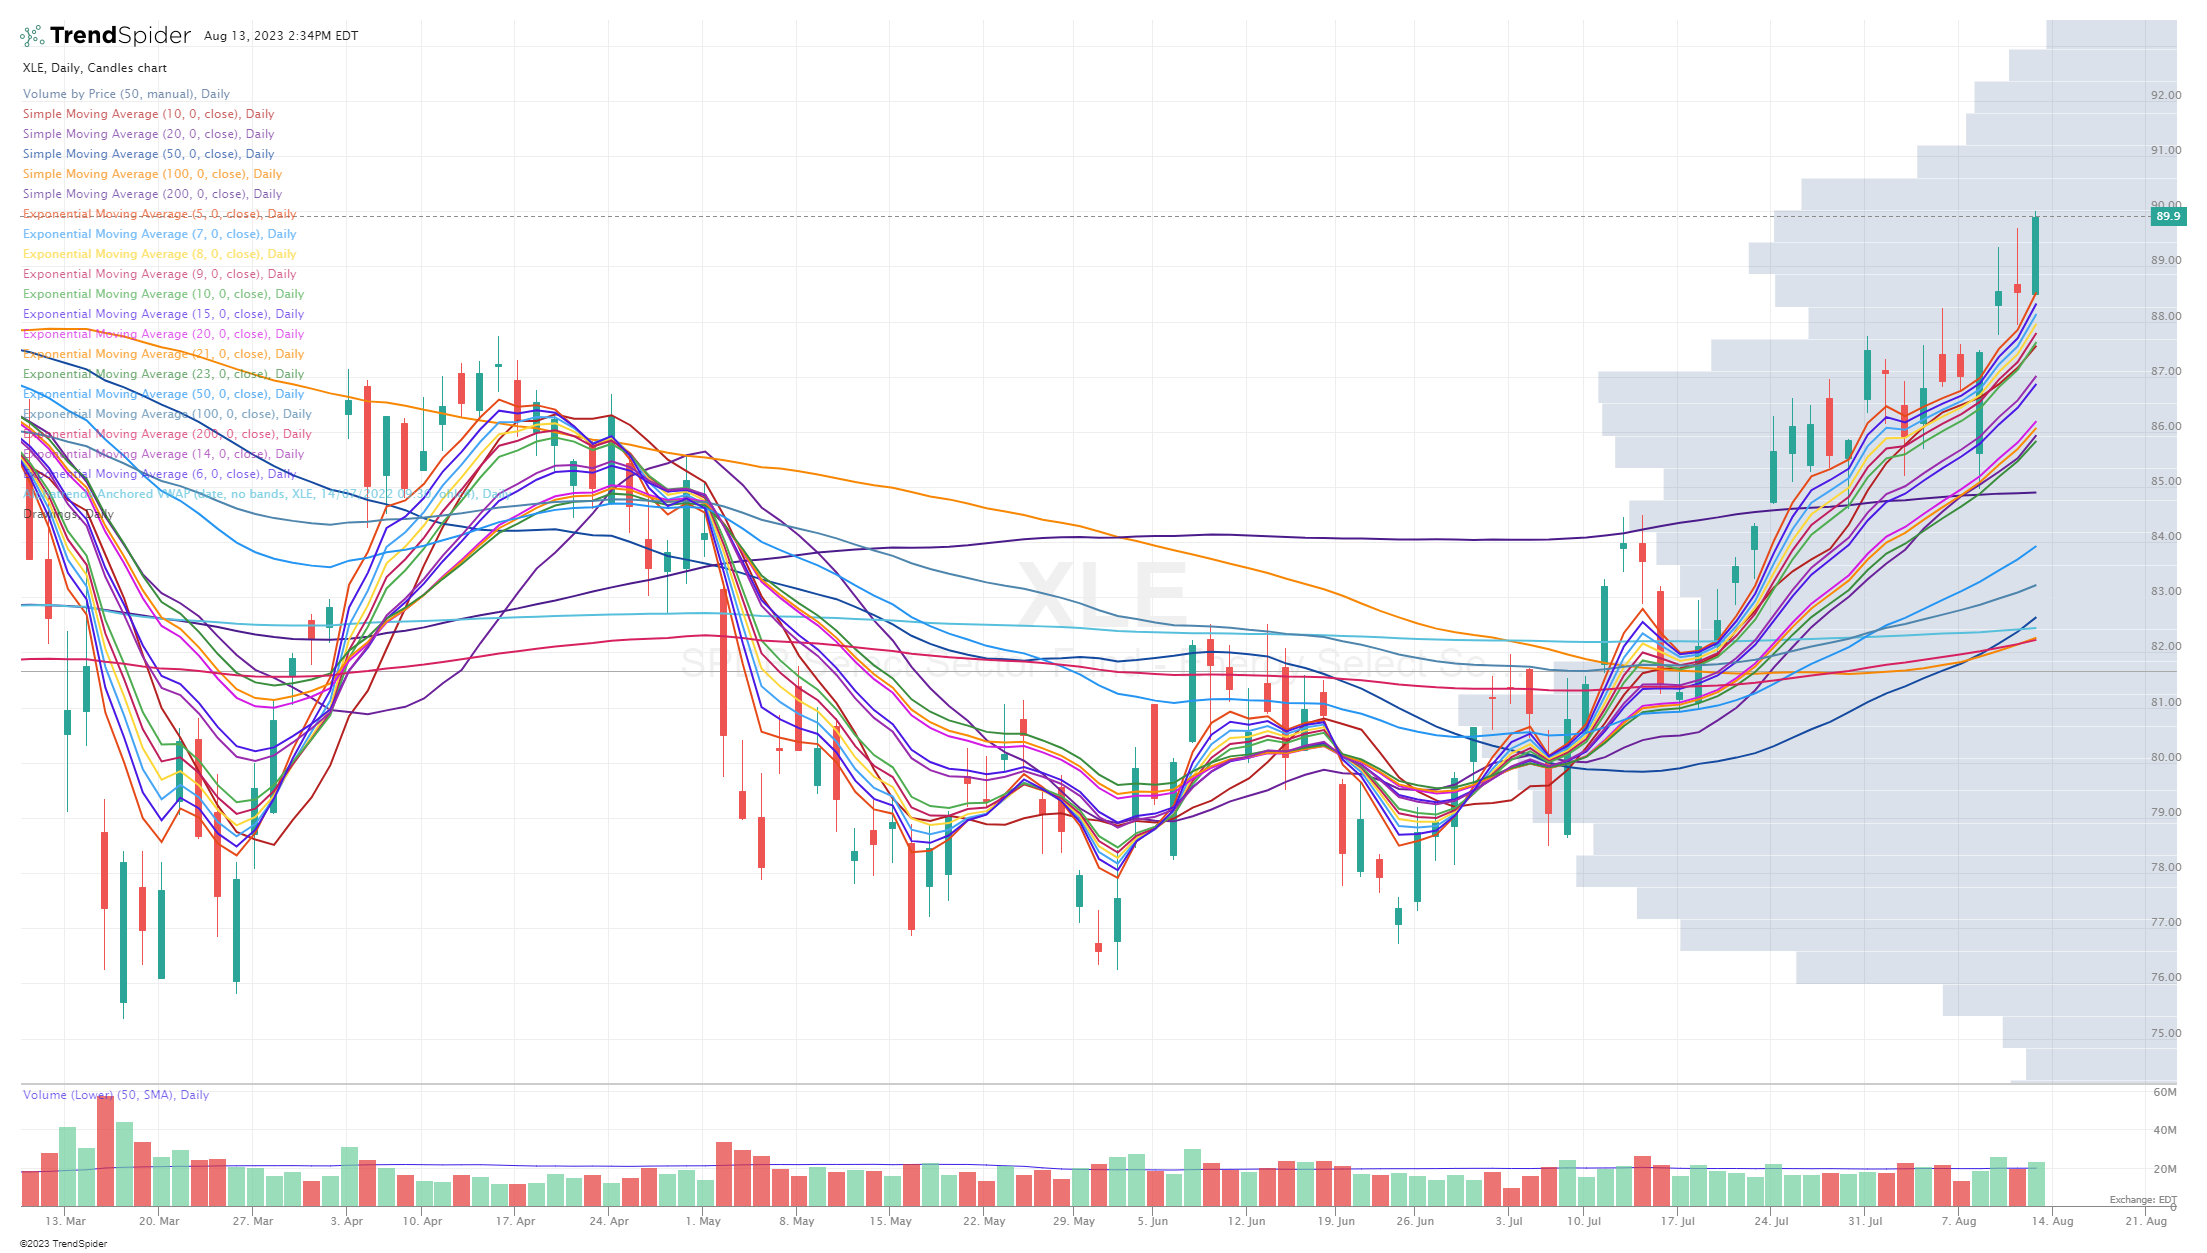
XLE (energy) looking very strong, by far the strongest sector right now, $93 is the next area of resistance which is January 2023 high.
XLI (industrials) might be the second best looking sector right now…

XLF (financials) also looking good, trying to hold onto the 23d ema, perhaps the third best looking sector right now.

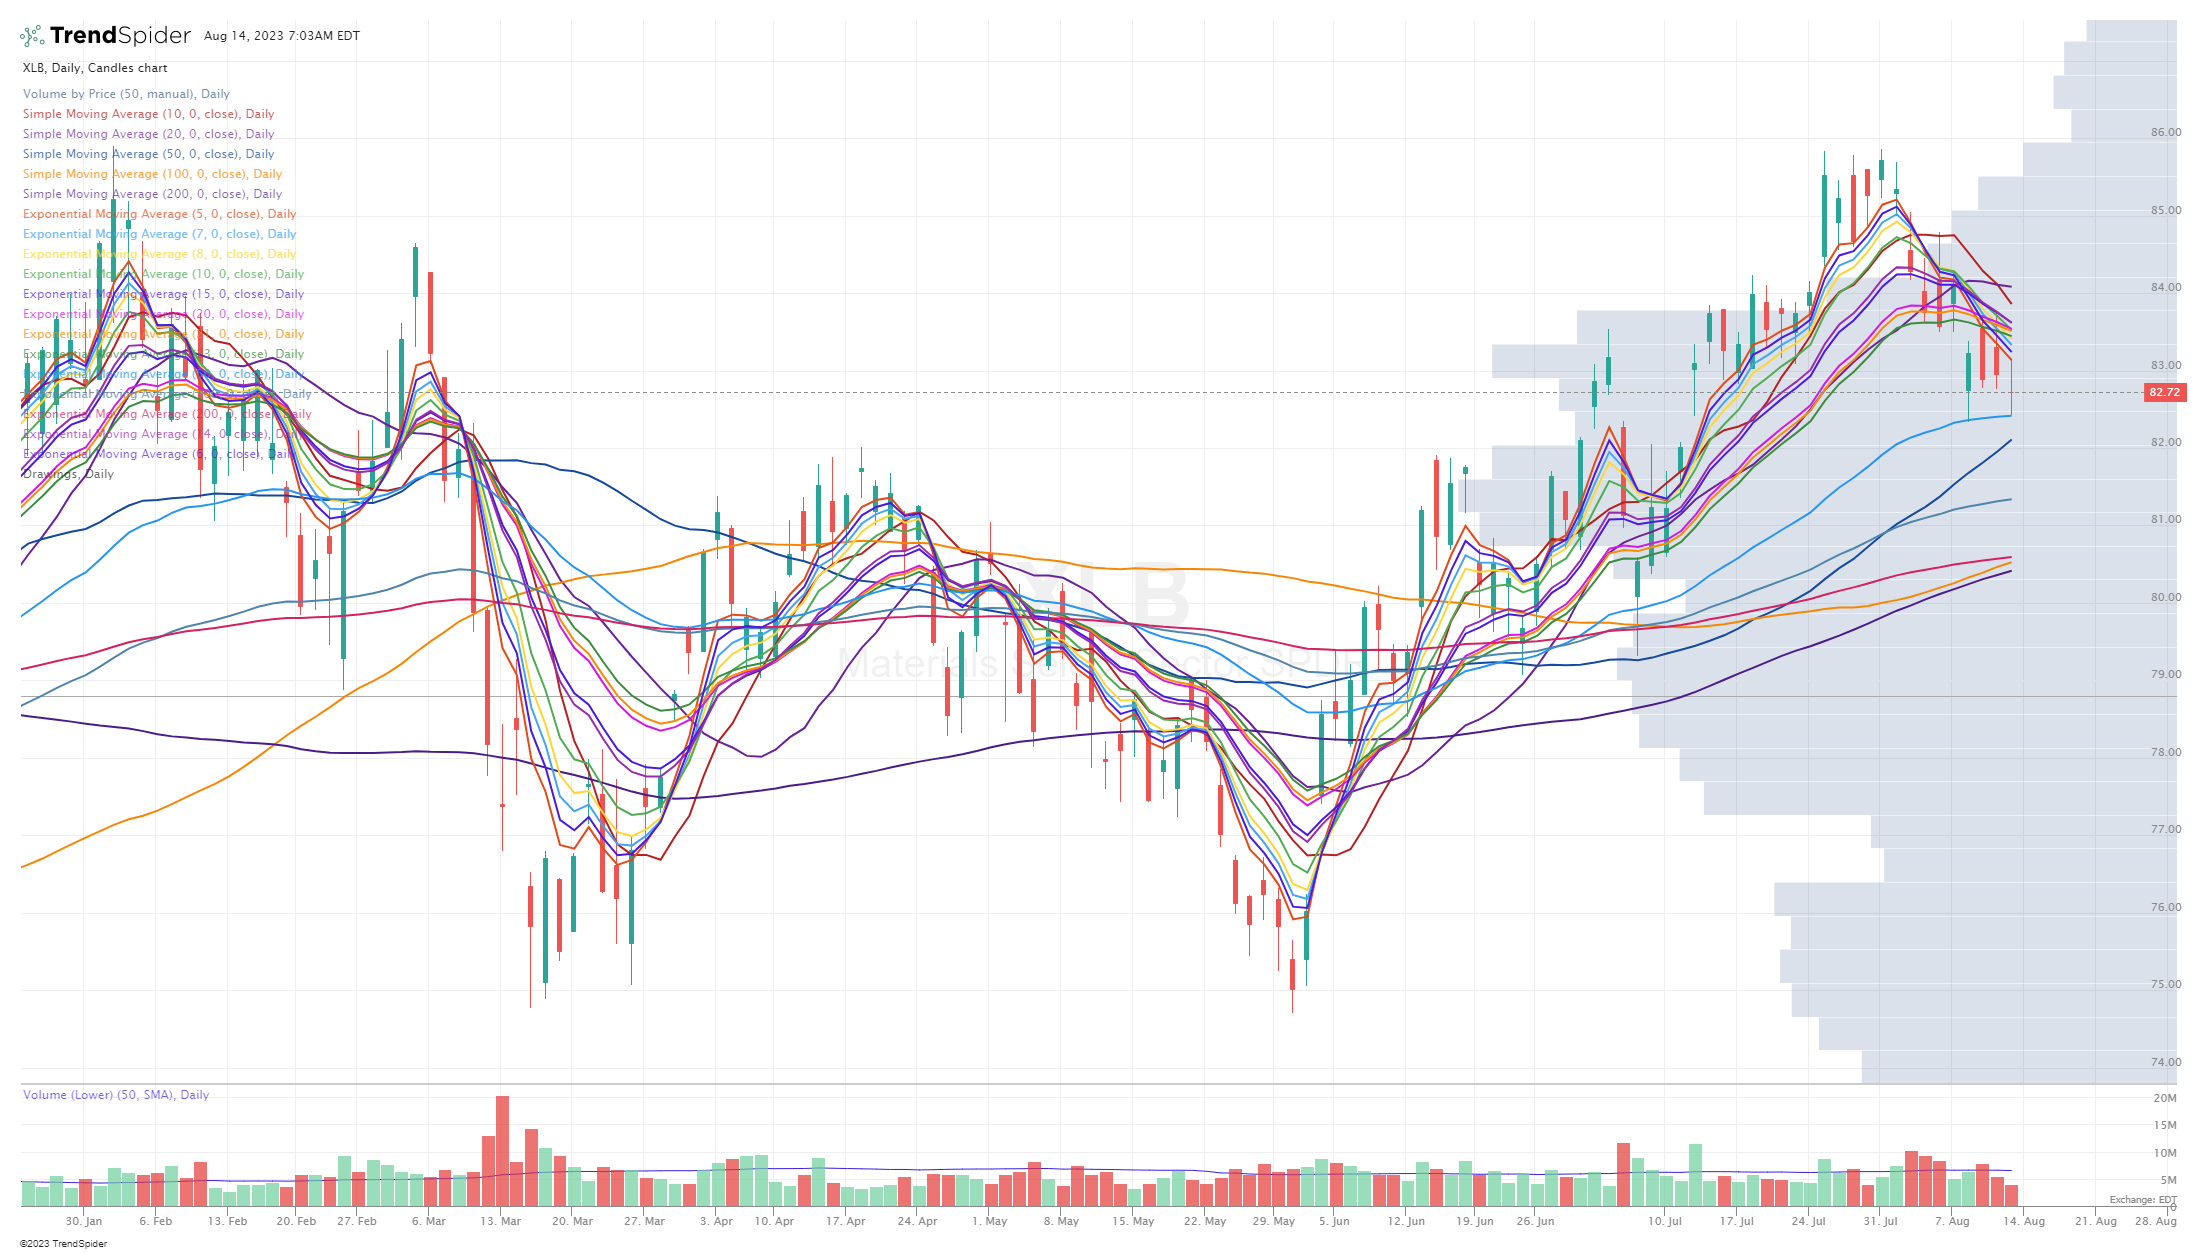
XLB (materials) bouncing off the 50d ema on Friday
I run Finviz screens every morning, yesterday I ran one with the following criteria: above $5, above 20d sma, above 50d sma, above 200d sma, less than 10% from 52 week high, over 100k daily volume, 20% EPS growth this year, 5% QoQ EPS growth, 5% QoQ sales growth. Here are the 90 results... AIT ALSN ANET ARCO AROC ARRY BBVA BKNG BLX BRBR CAE CCEP CEIX CELH CLS CMPR CNK CPNG CWCO DE DESP EDR EDU ELF EMR EPM ESE EXTR FCNCA FIX FLS FOR FRO FRSH GE GOOG HAE HLT HURN IHG INSW J JBI KEX KTOS LAUR LBRT MAR MEDP MELI MOD MSA MSCI MSGS NATI NECB NEWR NEX NICE NMFC NMIH NSSC ODD OSK PSN QLYS RDY ROP SLB SPOK STNE STRL TAC TCBI TCOM TDW TK TNK TT TTI TXT ULBI URI USAC V VAL VRSK WFRD XPEL XPRO
I put them into a Trendspider list: http://charts.trendspider.com/shared/64d8dca5d12e6e0017e62c70?t=1
Below the paywall is my current trading portfolio including all positions (open & closed), watchlists, entry prices, stop losses and YTD performance and my daily webcasts.