


Trading the Charts for Friday, August 11th

In order to read this entire newsletter which includes full access to my trading portfolio (up ~66% YTD), daily watchlist, daily activity (buys, sells, entry prices, stop losses, performance) and my daily webcasts you’ll need to become a paid subscriber by clicking the button below.
I also run a Stocktwits rooms where I post about my investment portfolio (up ~98% YTD and ~1,000% over the past 3-years) with full access to all holdings, performance, daily activity, market commentary, quarterly earnings analysis, daily webcasts and more.
Here are my deep dive newsletters…

Good morning and Happy Friday,
Yesterday CPI, both headline and core, came at +0.2% MoM with headline CPI now at 3.2% YoY and core CPI now at 4.7% YoY, we know the FOMC is more focused on core (which excludes food & energy) but hard to say if these numbers are still high enough to provoke more rate hikes or will the FOMC pause and wait for the lag effects.
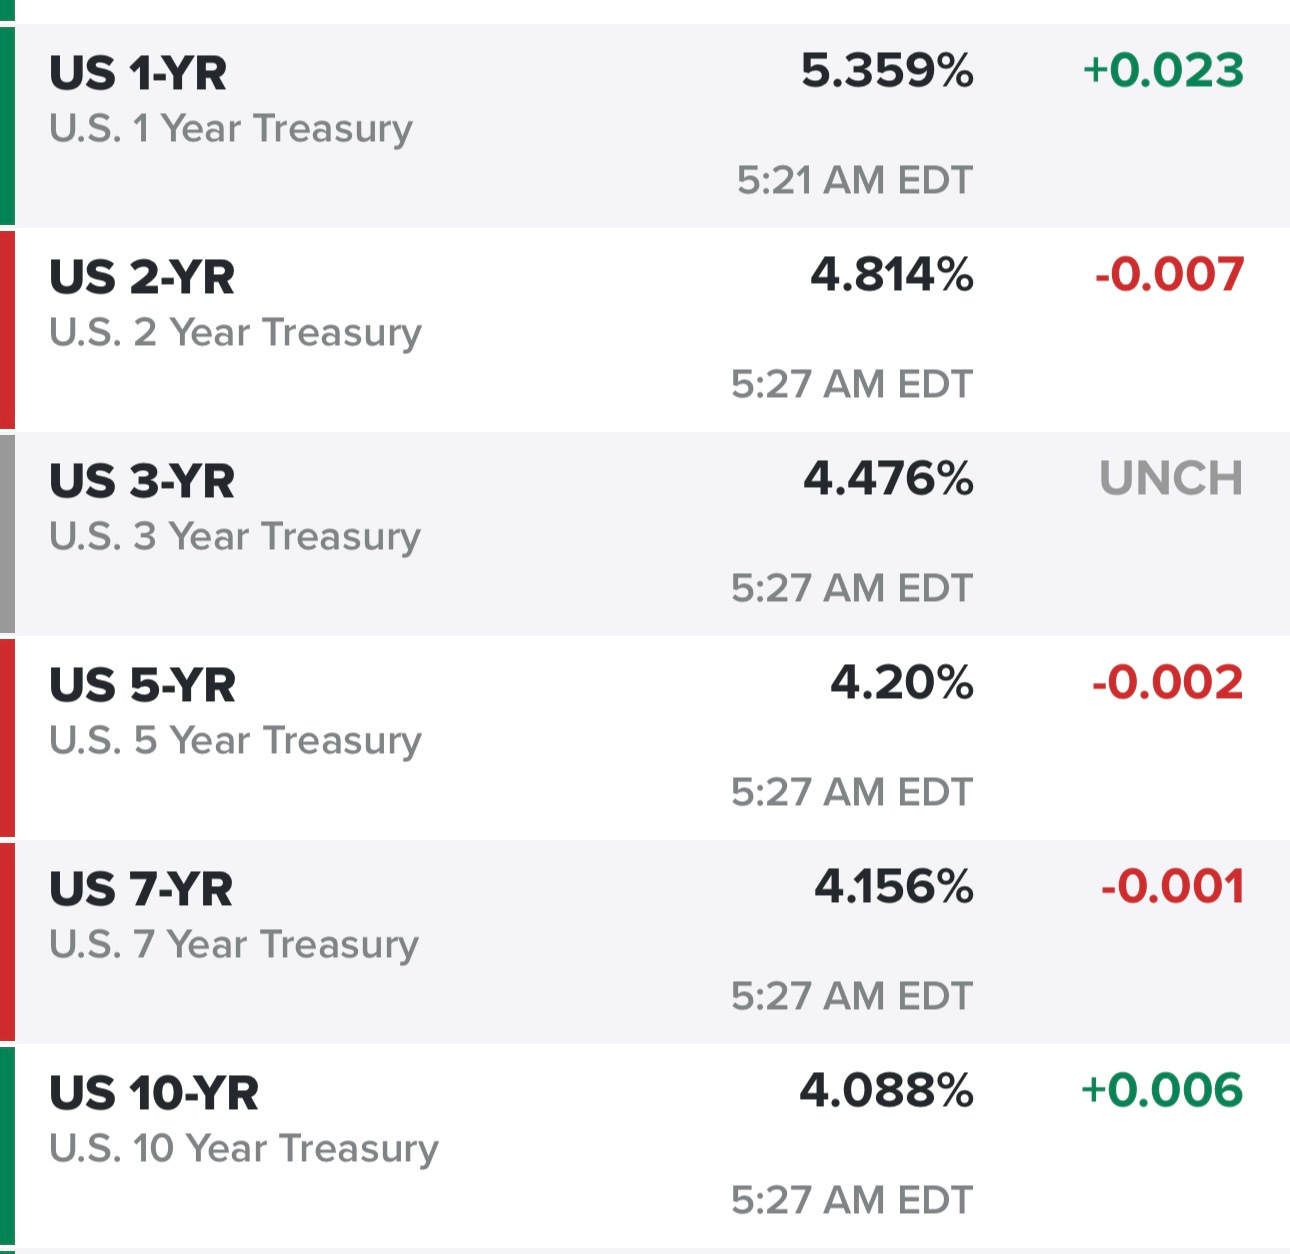
Yields dropped early yesterday on the “inline” CPI report but then spiked mid day after the disappointing 30-year government bond auction, 10Y now at 4.08%
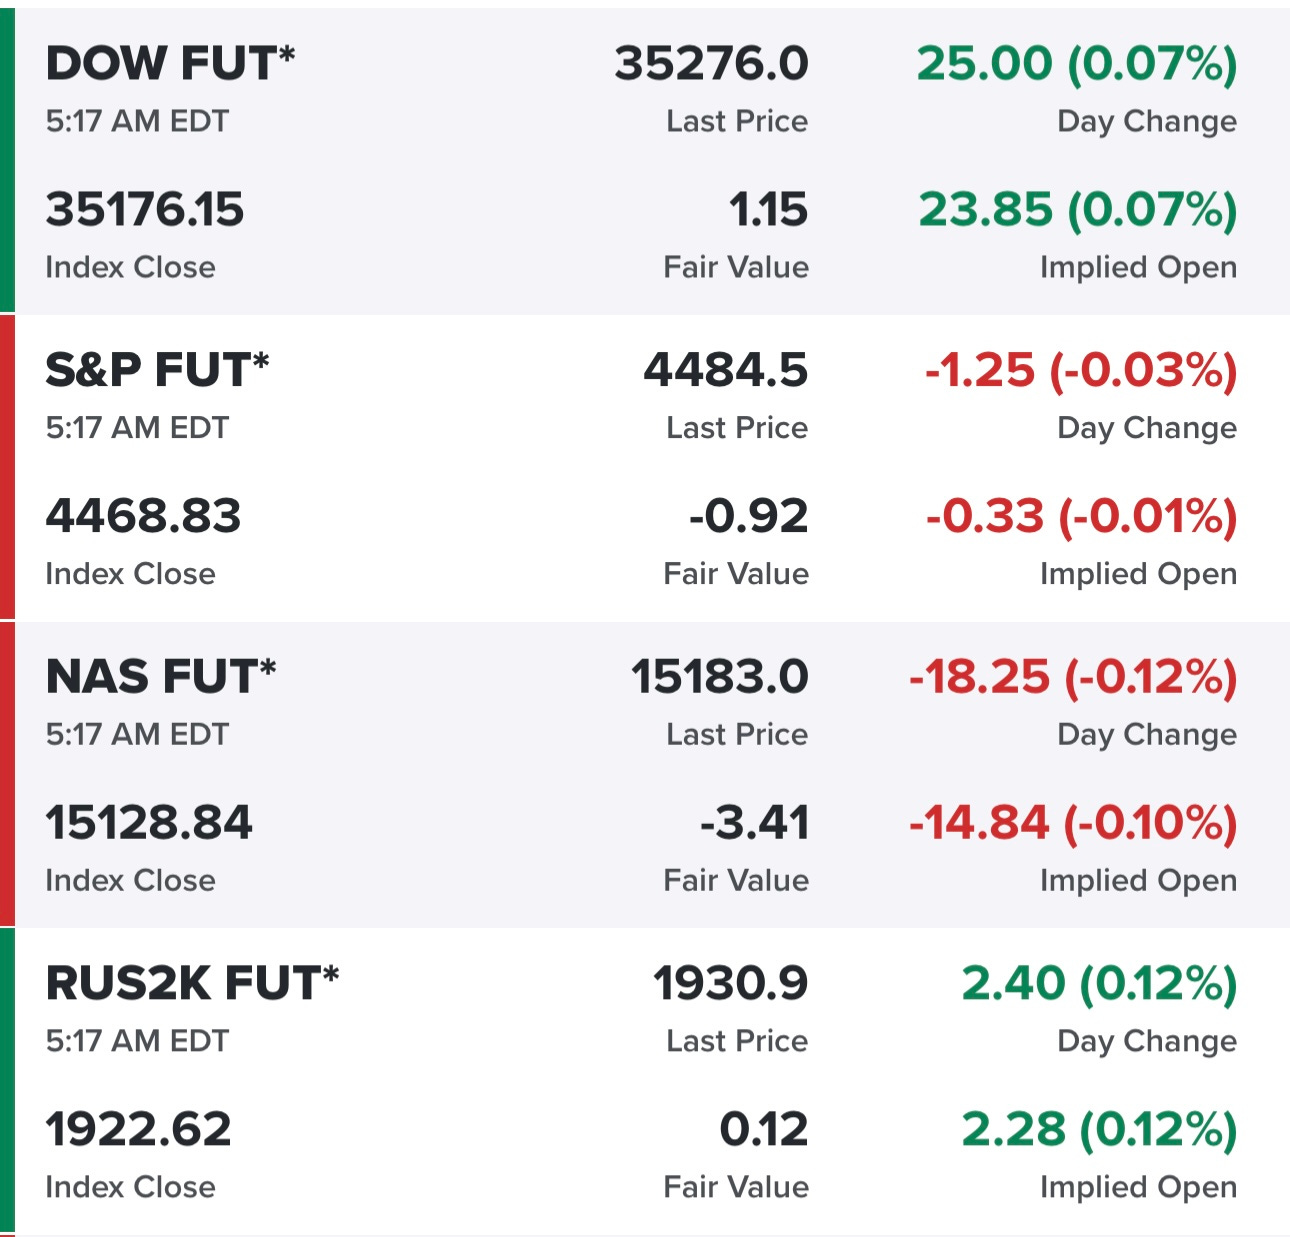
Futures are mostly flat ahead of a summer Friday which means light volume…
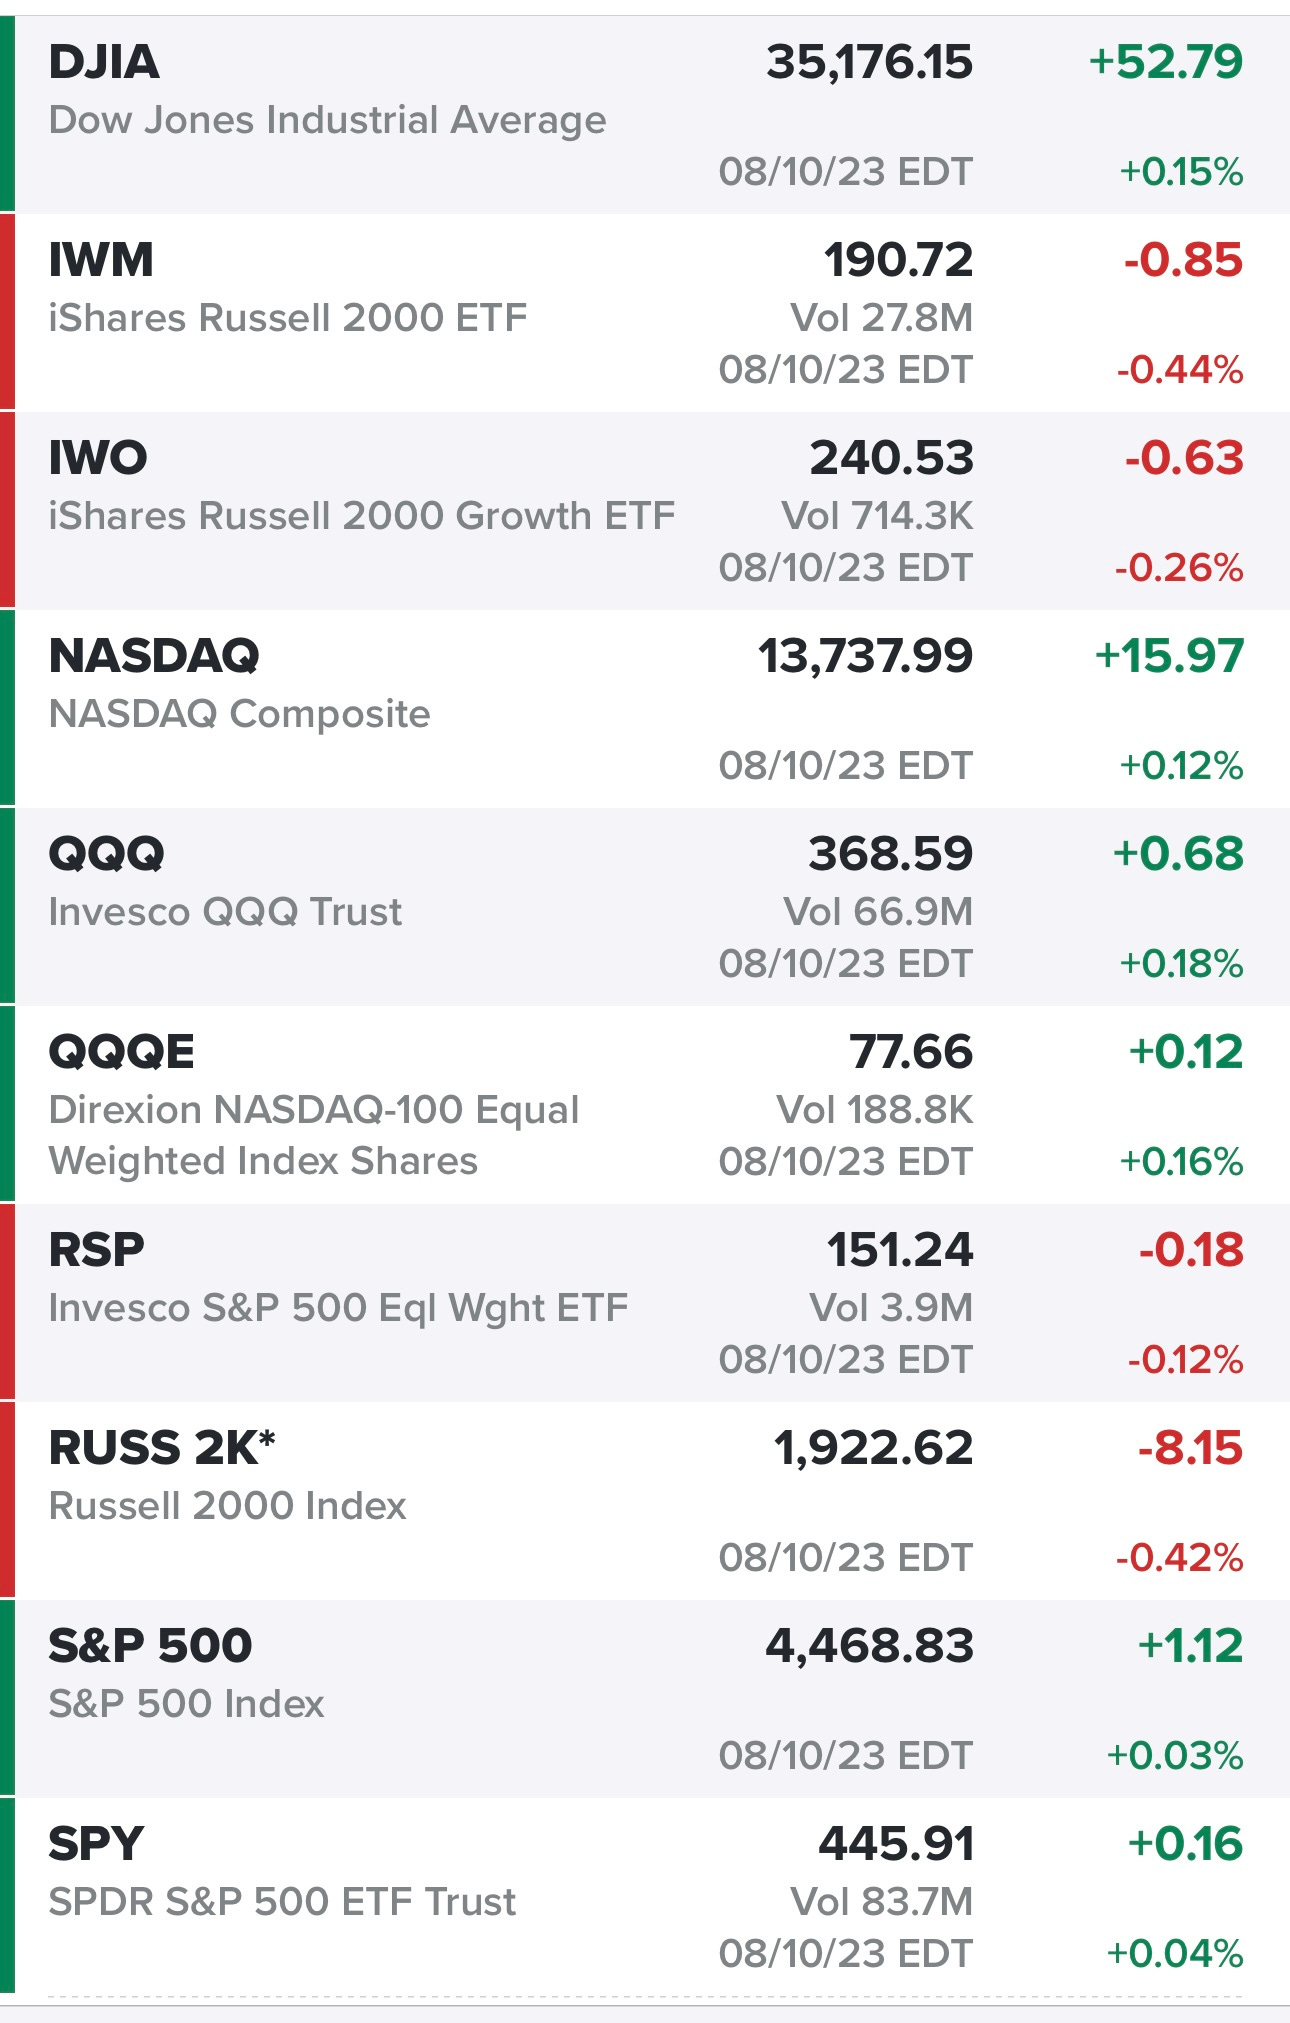
Indexes coming off a mixed day, the Dow Jones was up 400+ points at the highs and the Nasdaq was up 150+ points at the highs so a very big fade across the board. Once again growth stocks and small/mid caps showing relative weakness…
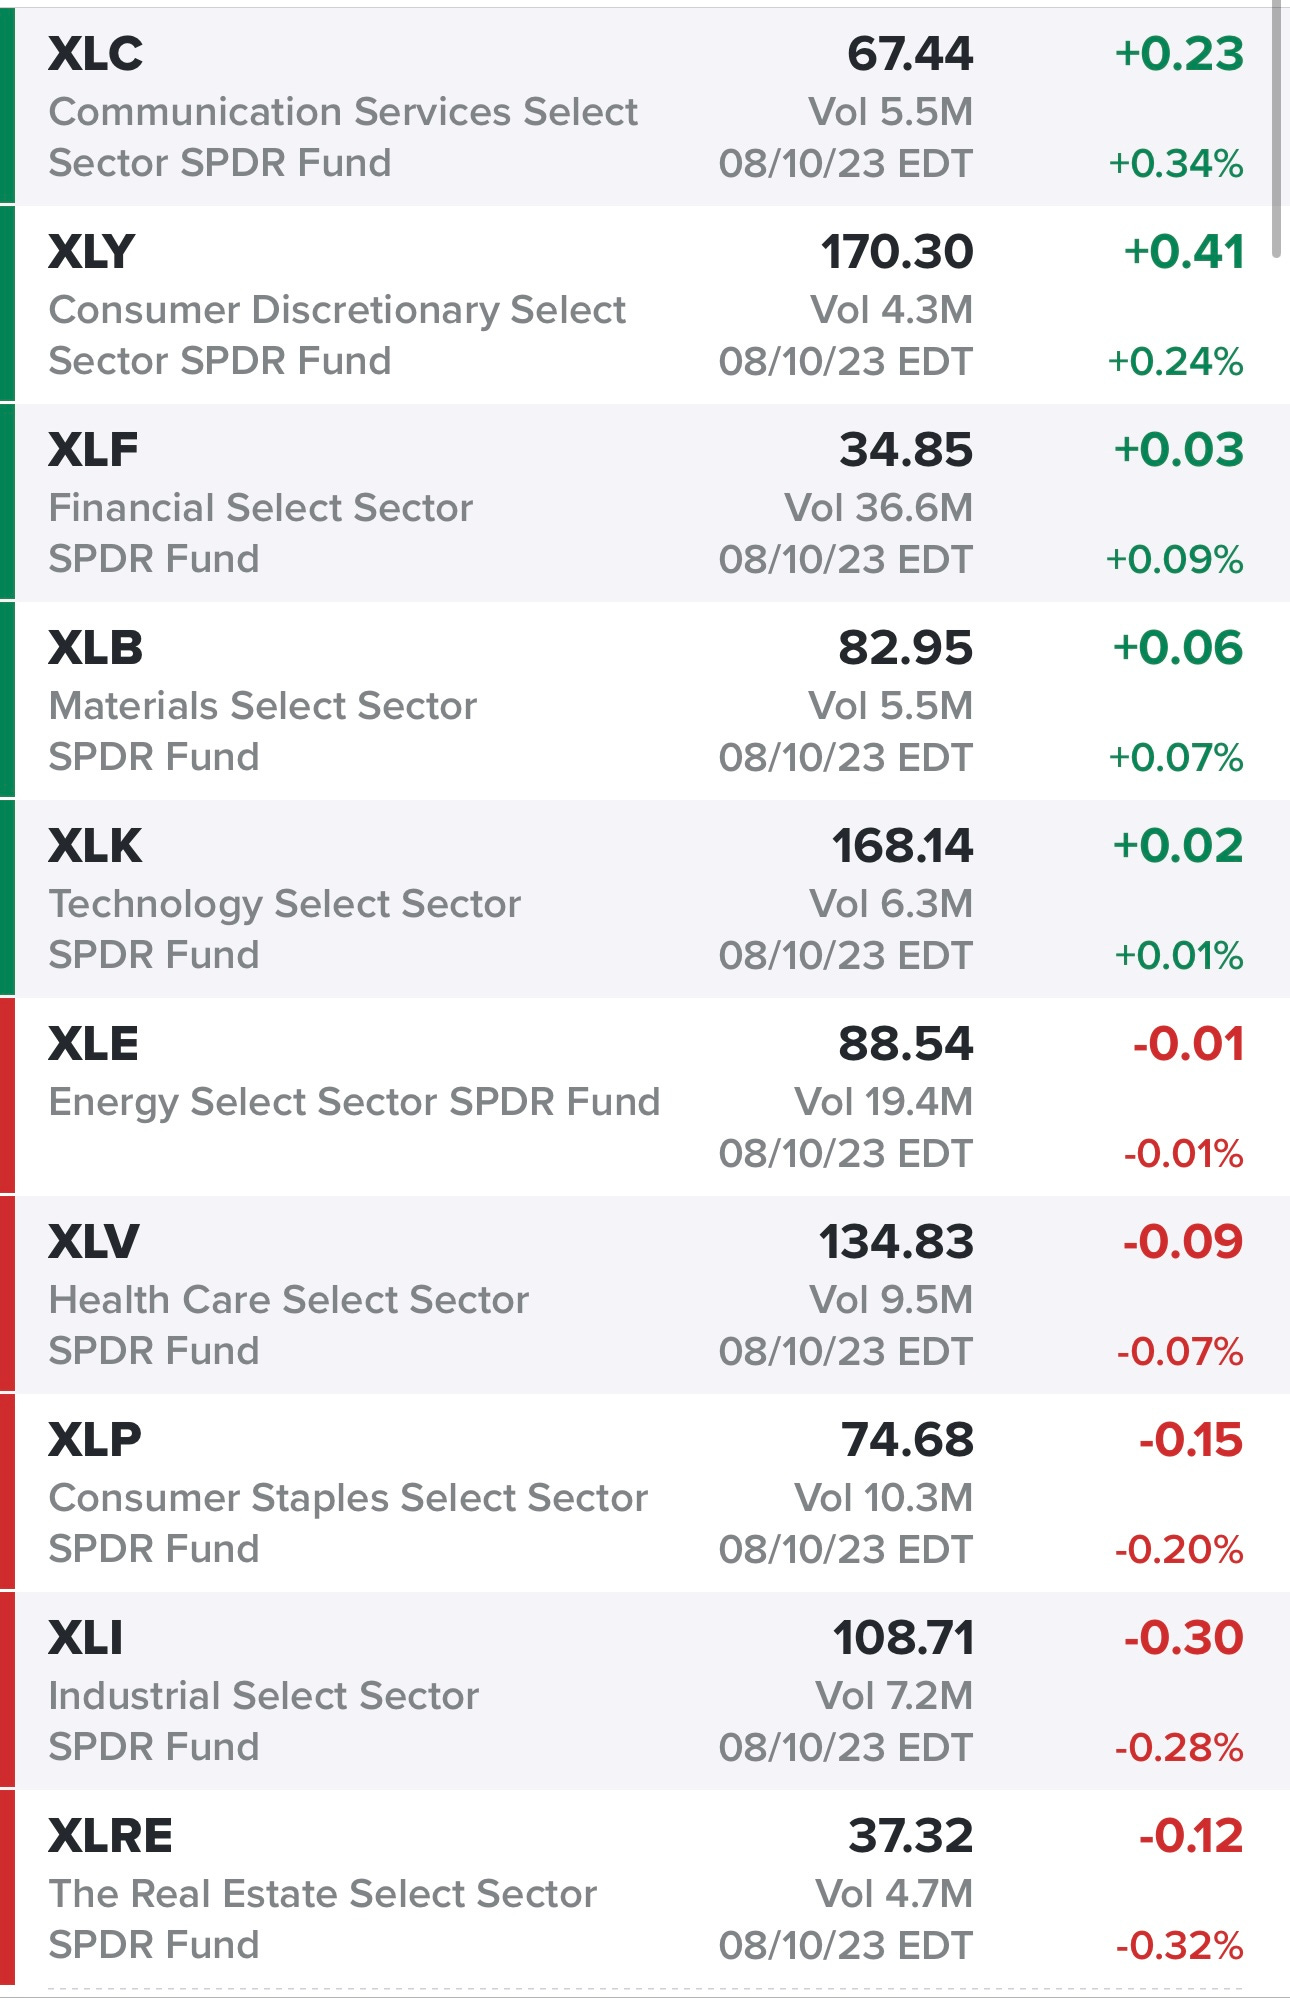
No big winners or losers in the sectors yesterday…
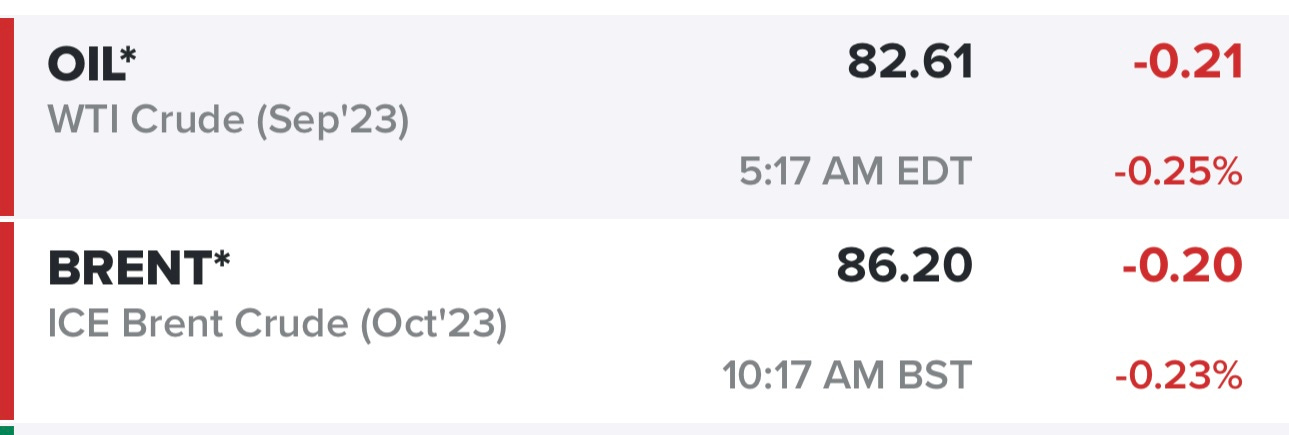
Oil still in the low $80s, almost hit $85 a couple days ago…
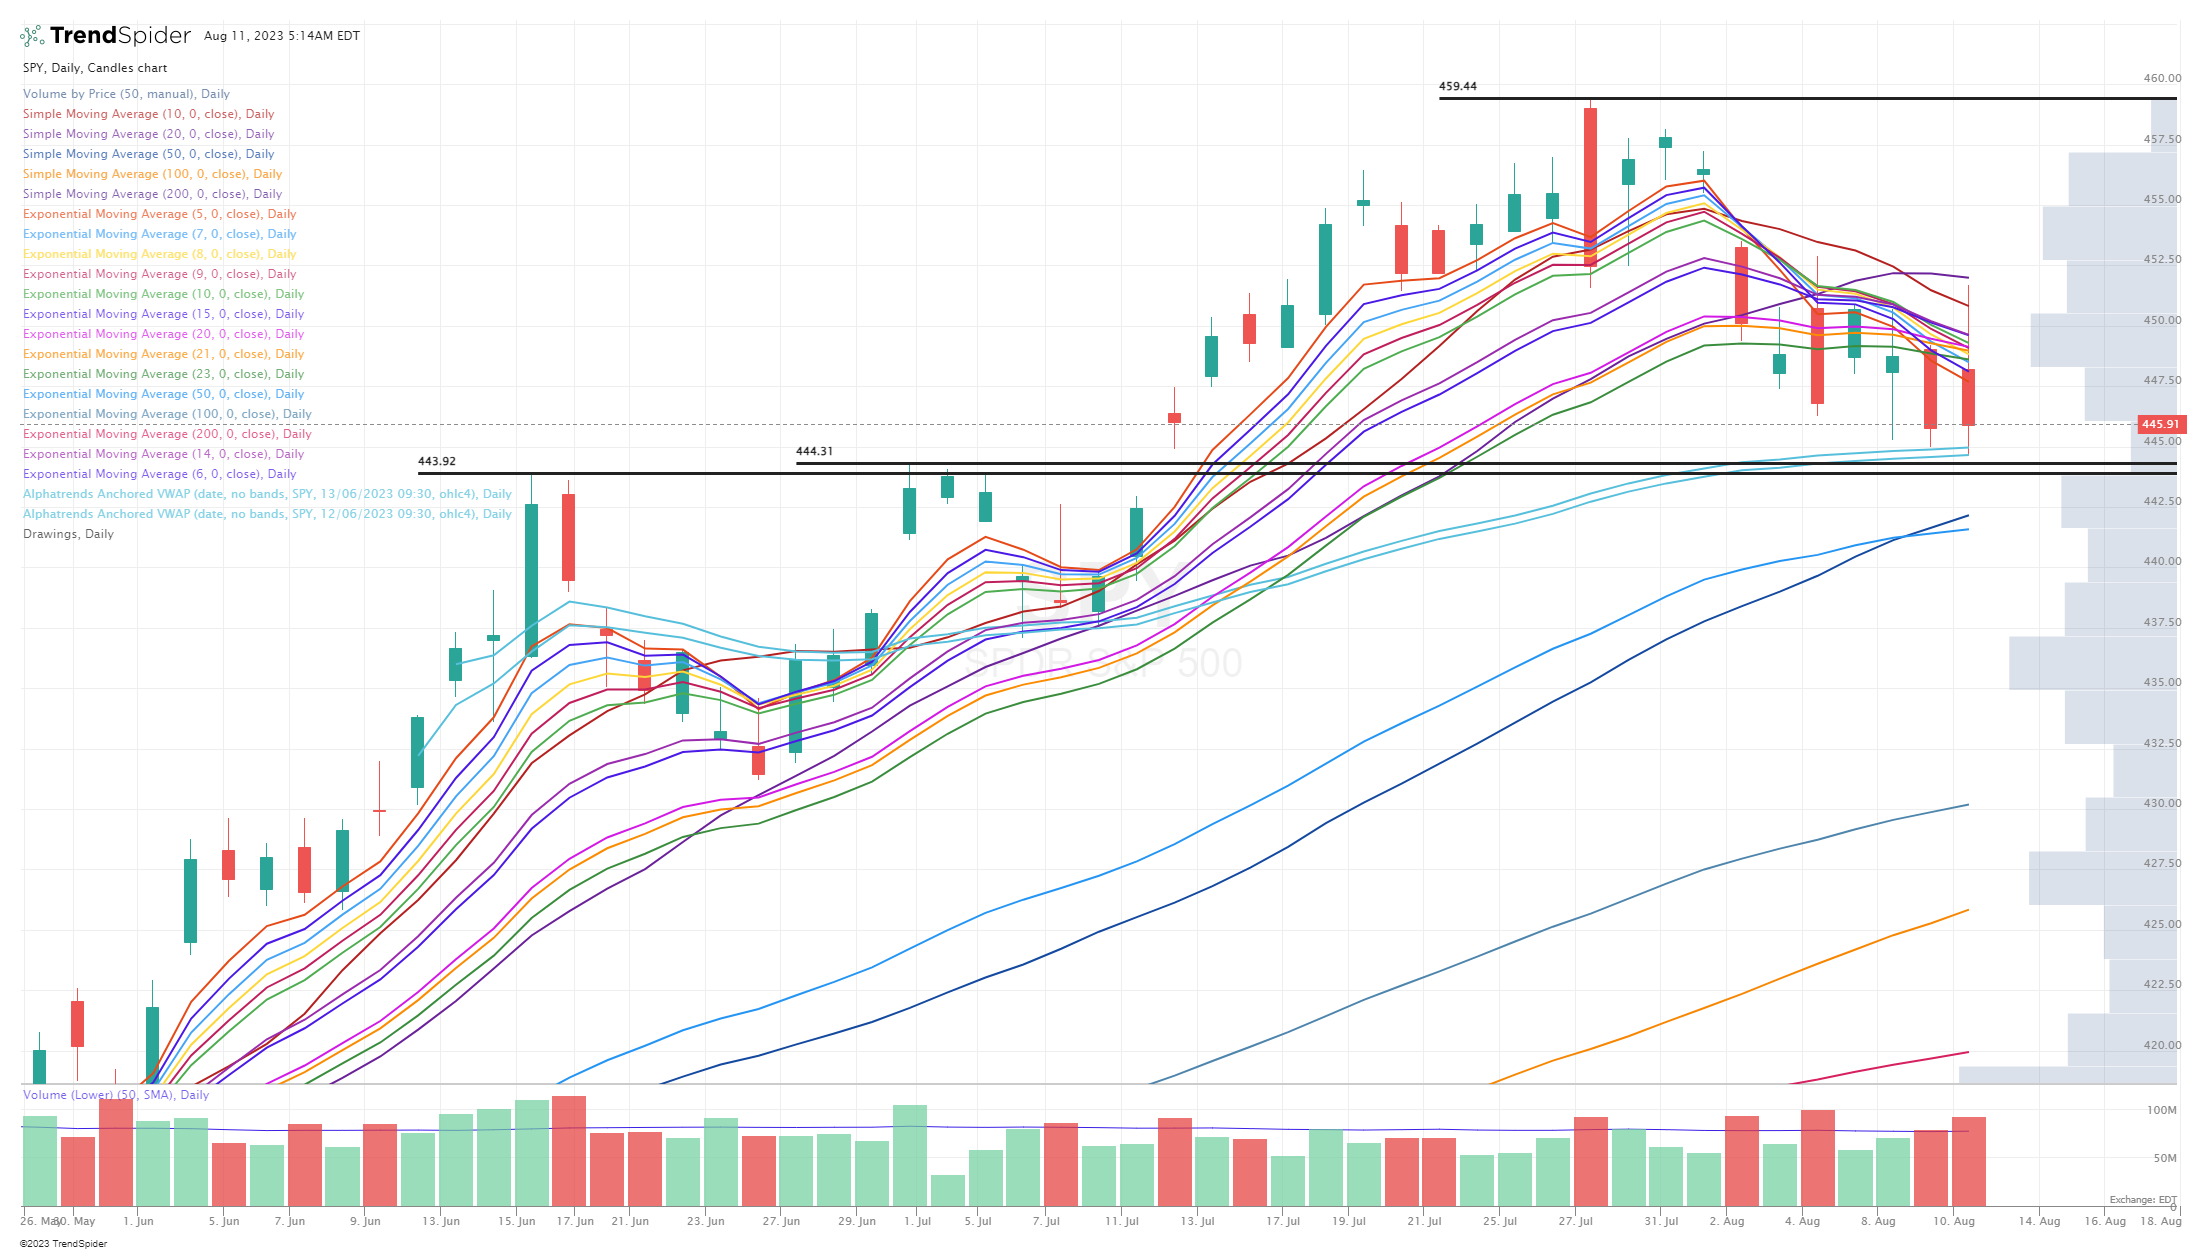
SPY — still right above that 444 pivot
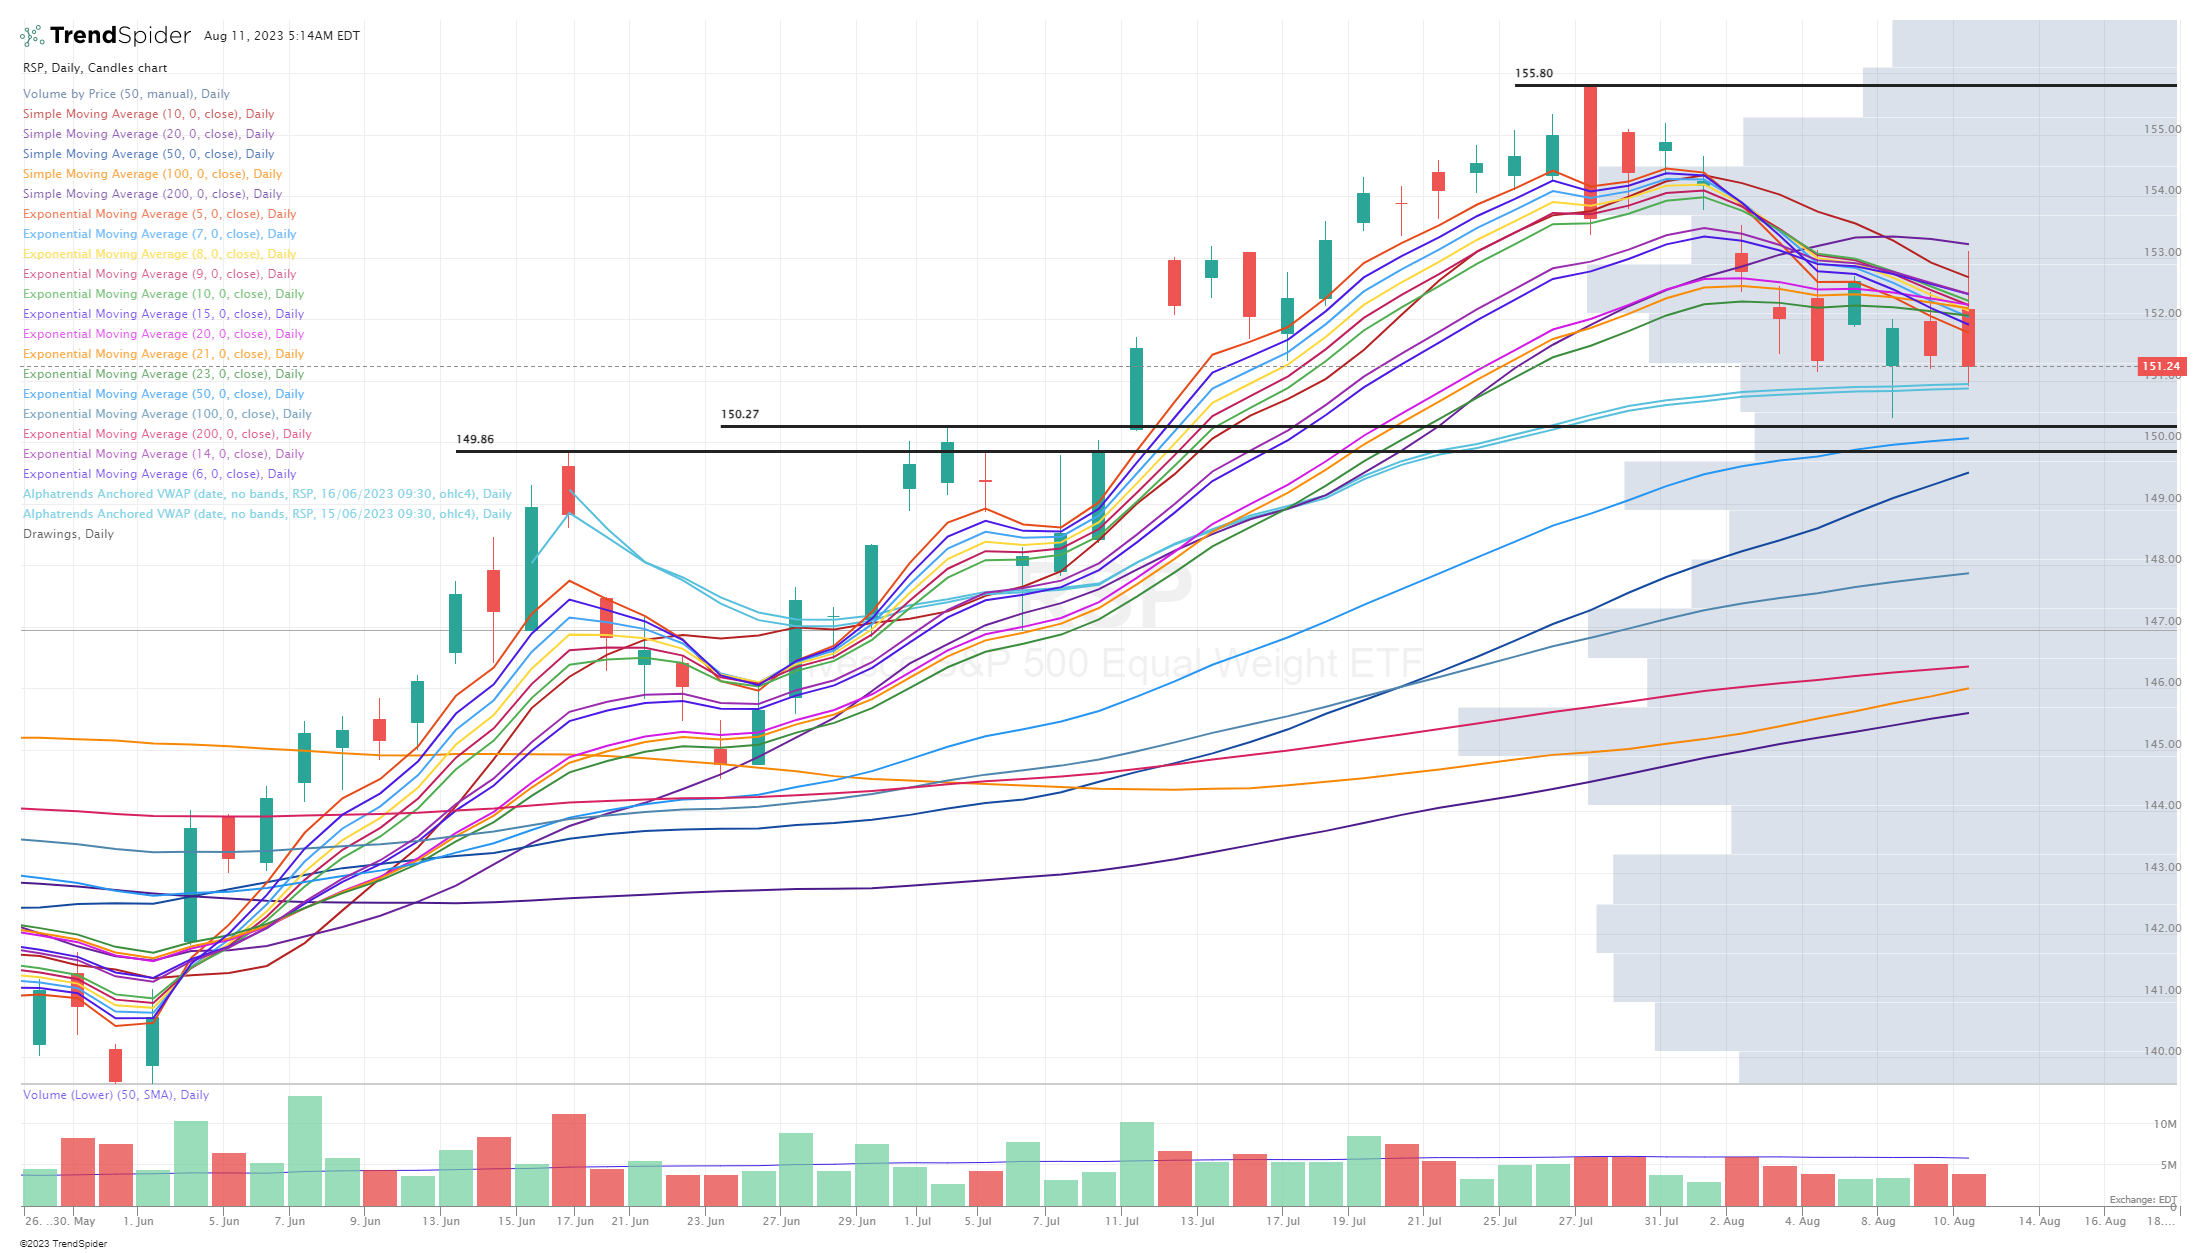
RSP — bouncing off the VWAPs but not sure if it’s relevant, 150 pivot plus 50d ema not far away
QQQ — bouncing off some VWAPs, trying to hang onto the 50d sma with 50d ema just below

QQQ2 — I saw a couple people on Twitter talking about the selling pressure getting more intense if QQQ closes below the 10w sma today but I partly disagree because it’s still above the 9/10w ema

QQQE — still unable to get back above the 78 pivot, still bouncing just above the 50d sma

IWM — just above the 189 pivot with 50d ema just below

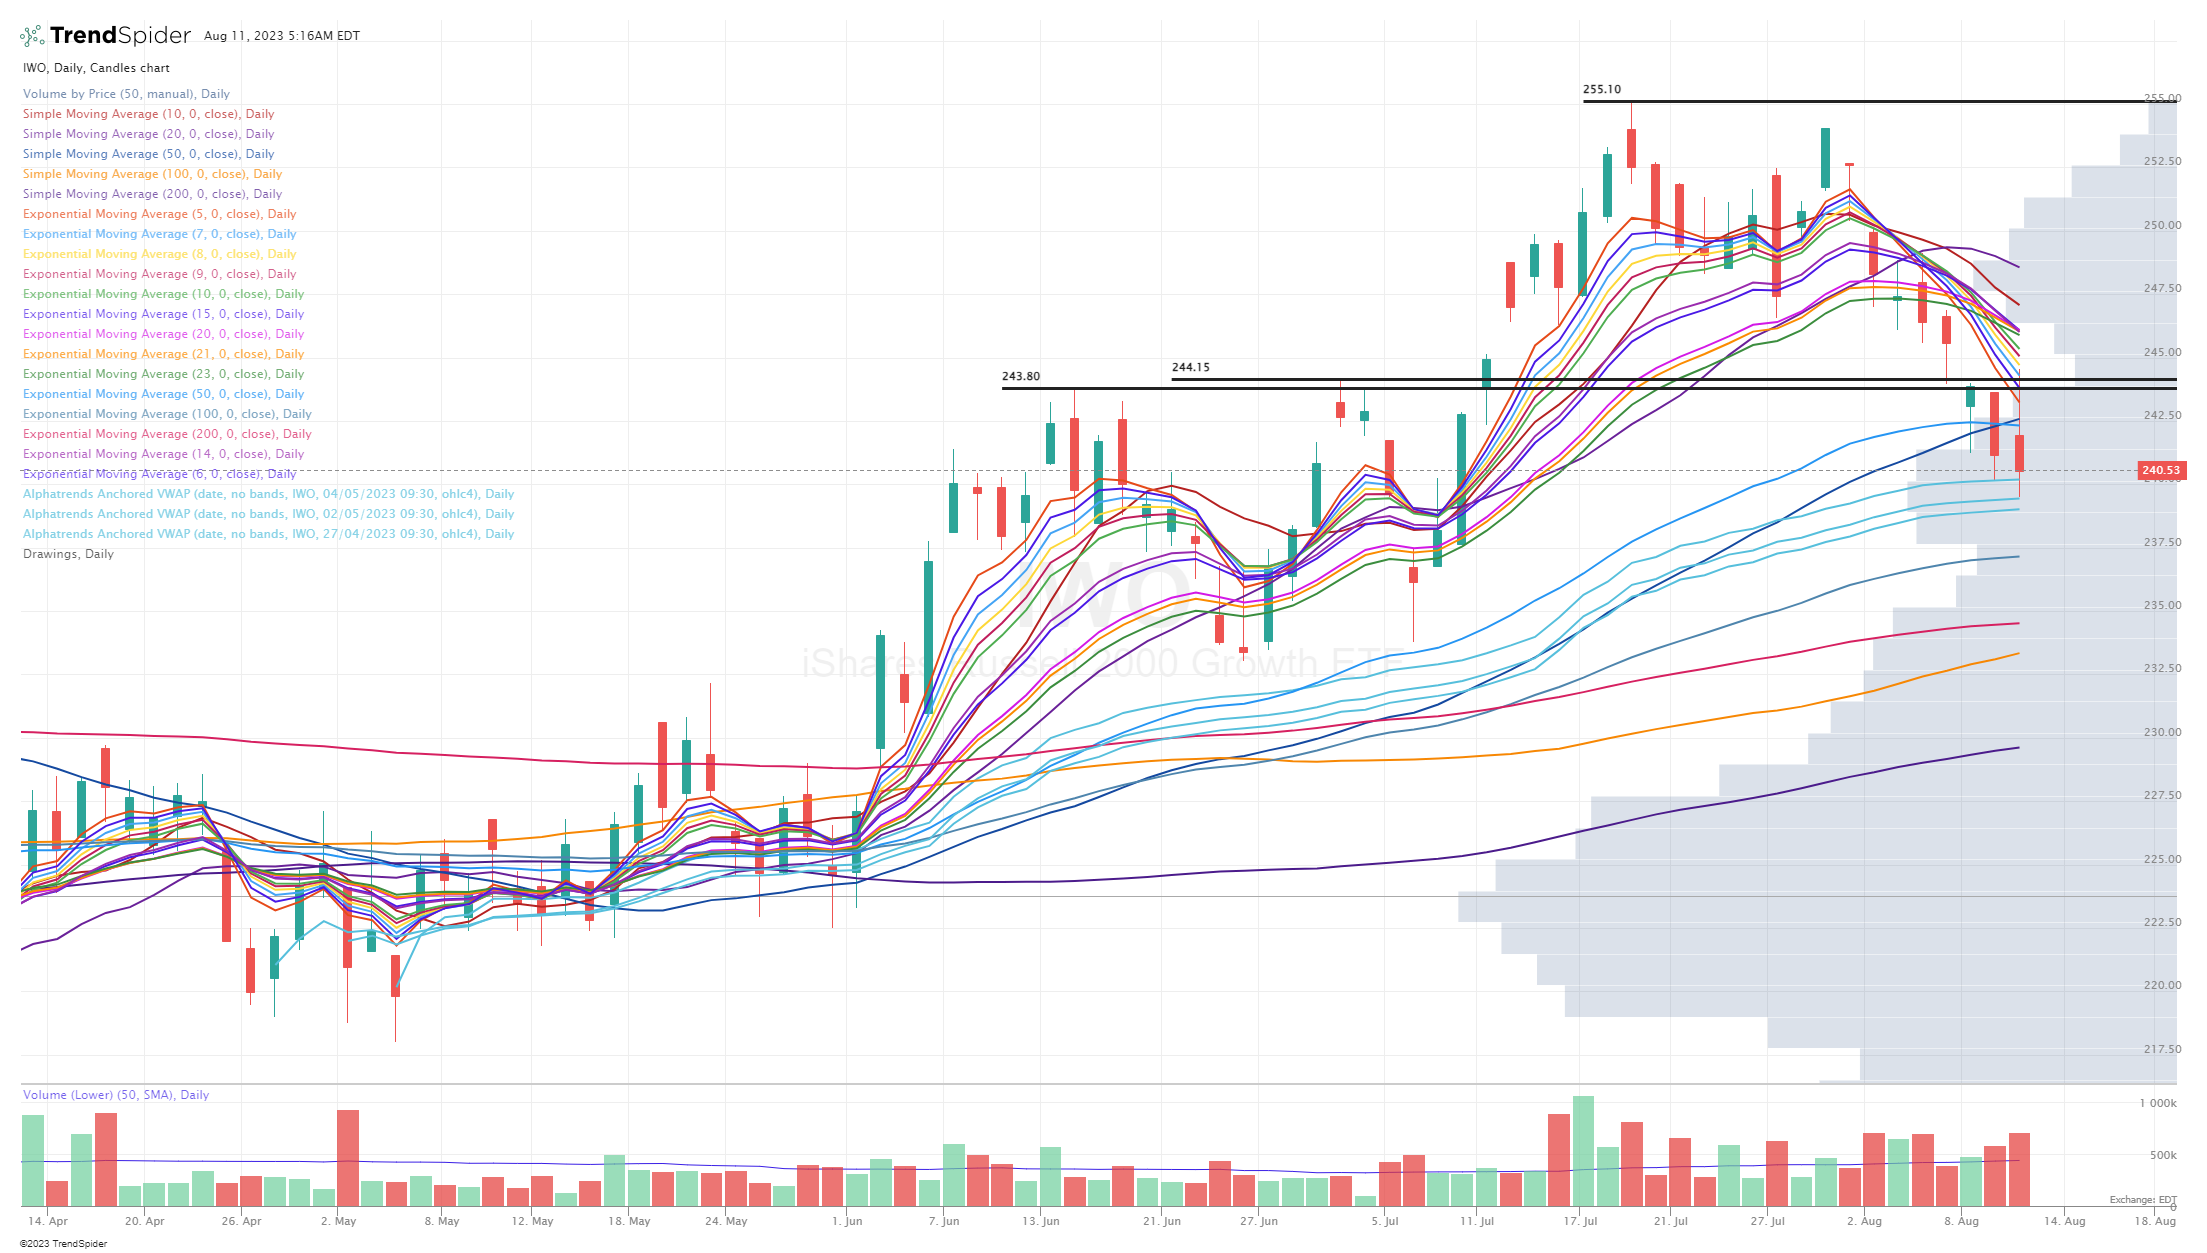
IWO — sliced through the 50d ema/sma this week, now trying to bounce off the VWAPs from May lows
ARKK — slicing through the 50d ema/sma earlier this week then the 200d ema and now trying to hang onto the VWAPs from May lows

Below the paywall is my current trading portfolio including all positions (open & closed), watchlists, entry prices, stop losses and YTD performance and my daily webcasts.