Trading the Charts for Tuesday, January 2nd
In order to read this entire newsletter you’ll need to become a paid subscriber by clicking the button below. Paid subscribers get full access to my trading portfolio (up +97.3% in 2023), daily watchlists with charts, daily activity with entry prices & stop losses, all trading stats with performance, and my daily webcasts.
I also run a Stocktwits room where I post throughout the day about my investment portfolio (up +134.7% in 2023 and +1,064% since January 2020) with full access to my current holdings, performance stats, daily activity, market commentary, quarterly earnings analysis, daily webcasts, investment models and much more.
Here’s my other Substack newsletter if you want my weekly deep dives (8,000+ words) and weekly mini deep dives (2,000+ words)…
Trading Strategy for 2024:
Obviously things will change throughout the year depending on what the markets are doing and whether I’m capturing/maximizing the right opportunities with the right positions sizes and risk management but going into 2024 here’s how I hope/plan on hitting triple digit returns:
~5 trades per day
~240 trading days in the year
~1200 total trades
~45% win rate
+6% average winner
-2% average loser
~6% average position size
If these are my stats at the end of 2024 then my performance should be around +115% for the year.
There will be days when I have more than 5 trades and days when I have less. There will be months when my average winner is above 6% and months when my average winner is below 6%.
I don’t know if a 45% win rate is achievable with my strategy unless we get a very good market. I did 45% win rate the past 2 months but we all know the markets acted really well. I could probably do 60% win rates but that means I’m being super aggressive moving up my stop losses thus missing alot of double digit winners because I’m getting stopped out too quickly to protect green-to-red trades. I think a 40% win rate is more reasonable given my strategy which requires me to keep stop losses tighter.
If the markets are acting really well and I’m riding my winners longer than normal, it’s likely in this scenario that I’m trading less than 5x per day but my average exit would likely be above 6%.
If we get strong markets this year, especially for small/mid cap growth stocks then I’m confident I’ll have a huge year, perhaps triple digits but let’s be clear, if the markets are crap then most of our returns won’t be anything special. If it’s a choppy year (which I think is likely) and the markets finish up 8-10% then I’d like to be up at least 40-50% but that’s only possible if we find the right setups and catch some of the big winners. However if SPY and QQQ are up 8-10% this year, but IWM/IWO are up 20-30% then I’d like to be up at least 80-100% but once again we need to find the right setups and know when to press it long but also when to sell our winners and hide in cash.
If the markets are crap this year, the goal is to hide in cash as long as possible and wait for the rallies, perhaps doing some shorting along the way.
Even in a crap market there are still pockets of strength however sometimes it’s just better to sit in cash and wait for better setups because even if we end up in a bear market this year we’ll still see some rallies along the way.
Here’s something to think about… if the markets are acting like crap because the economy is slowing down too fast, not only are analysts lowering EPS estimates, but the FOMC would be forced to cut rates more aggressively than current expectations in which case we might want to avoid stocks altogether and focus on bond ETFs ie TLT and TMF.
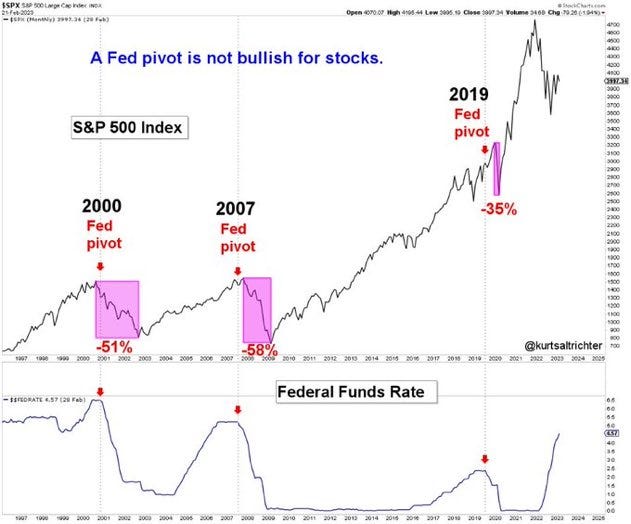
I know investors are cheering on the possibility of FOMC rate cuts in the next few months but keep in mind that rate cuts don’t always coincide with good markets but as we know from the past 12-18 months, nothing is predictable so be prepared for anything which means stay nimble and don’t be stubborn. The best traders & investors are the ones with an open mind who pivot quickly when they have new data to work with.
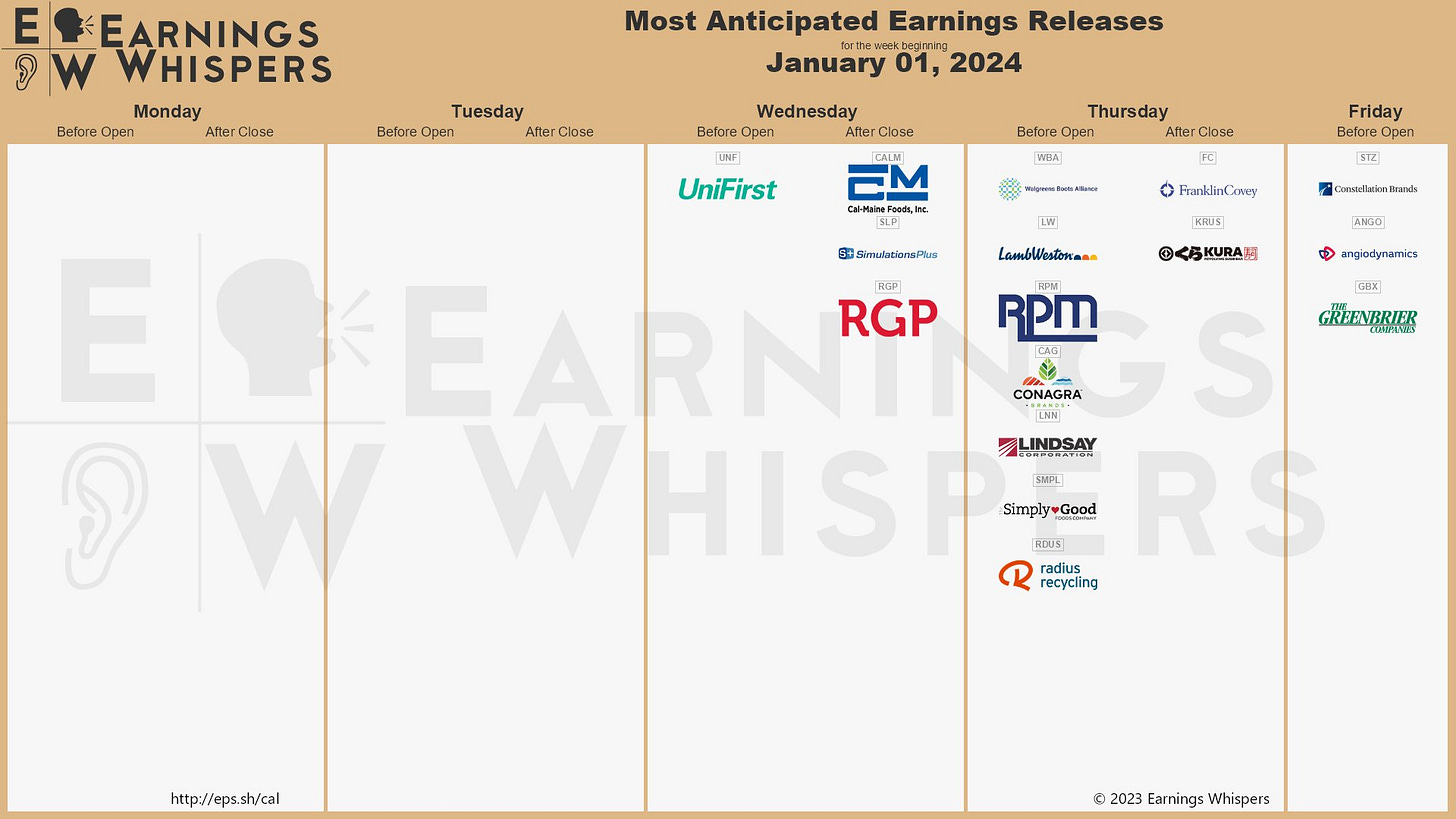
Earnings reports for the week…
Macro reports for the week…
FOMC updates…
Small/mid caps (IWM) finished the year very strong, last time they finished the year this strong was 2020 and then they added another 11% in the first two months of 2021…
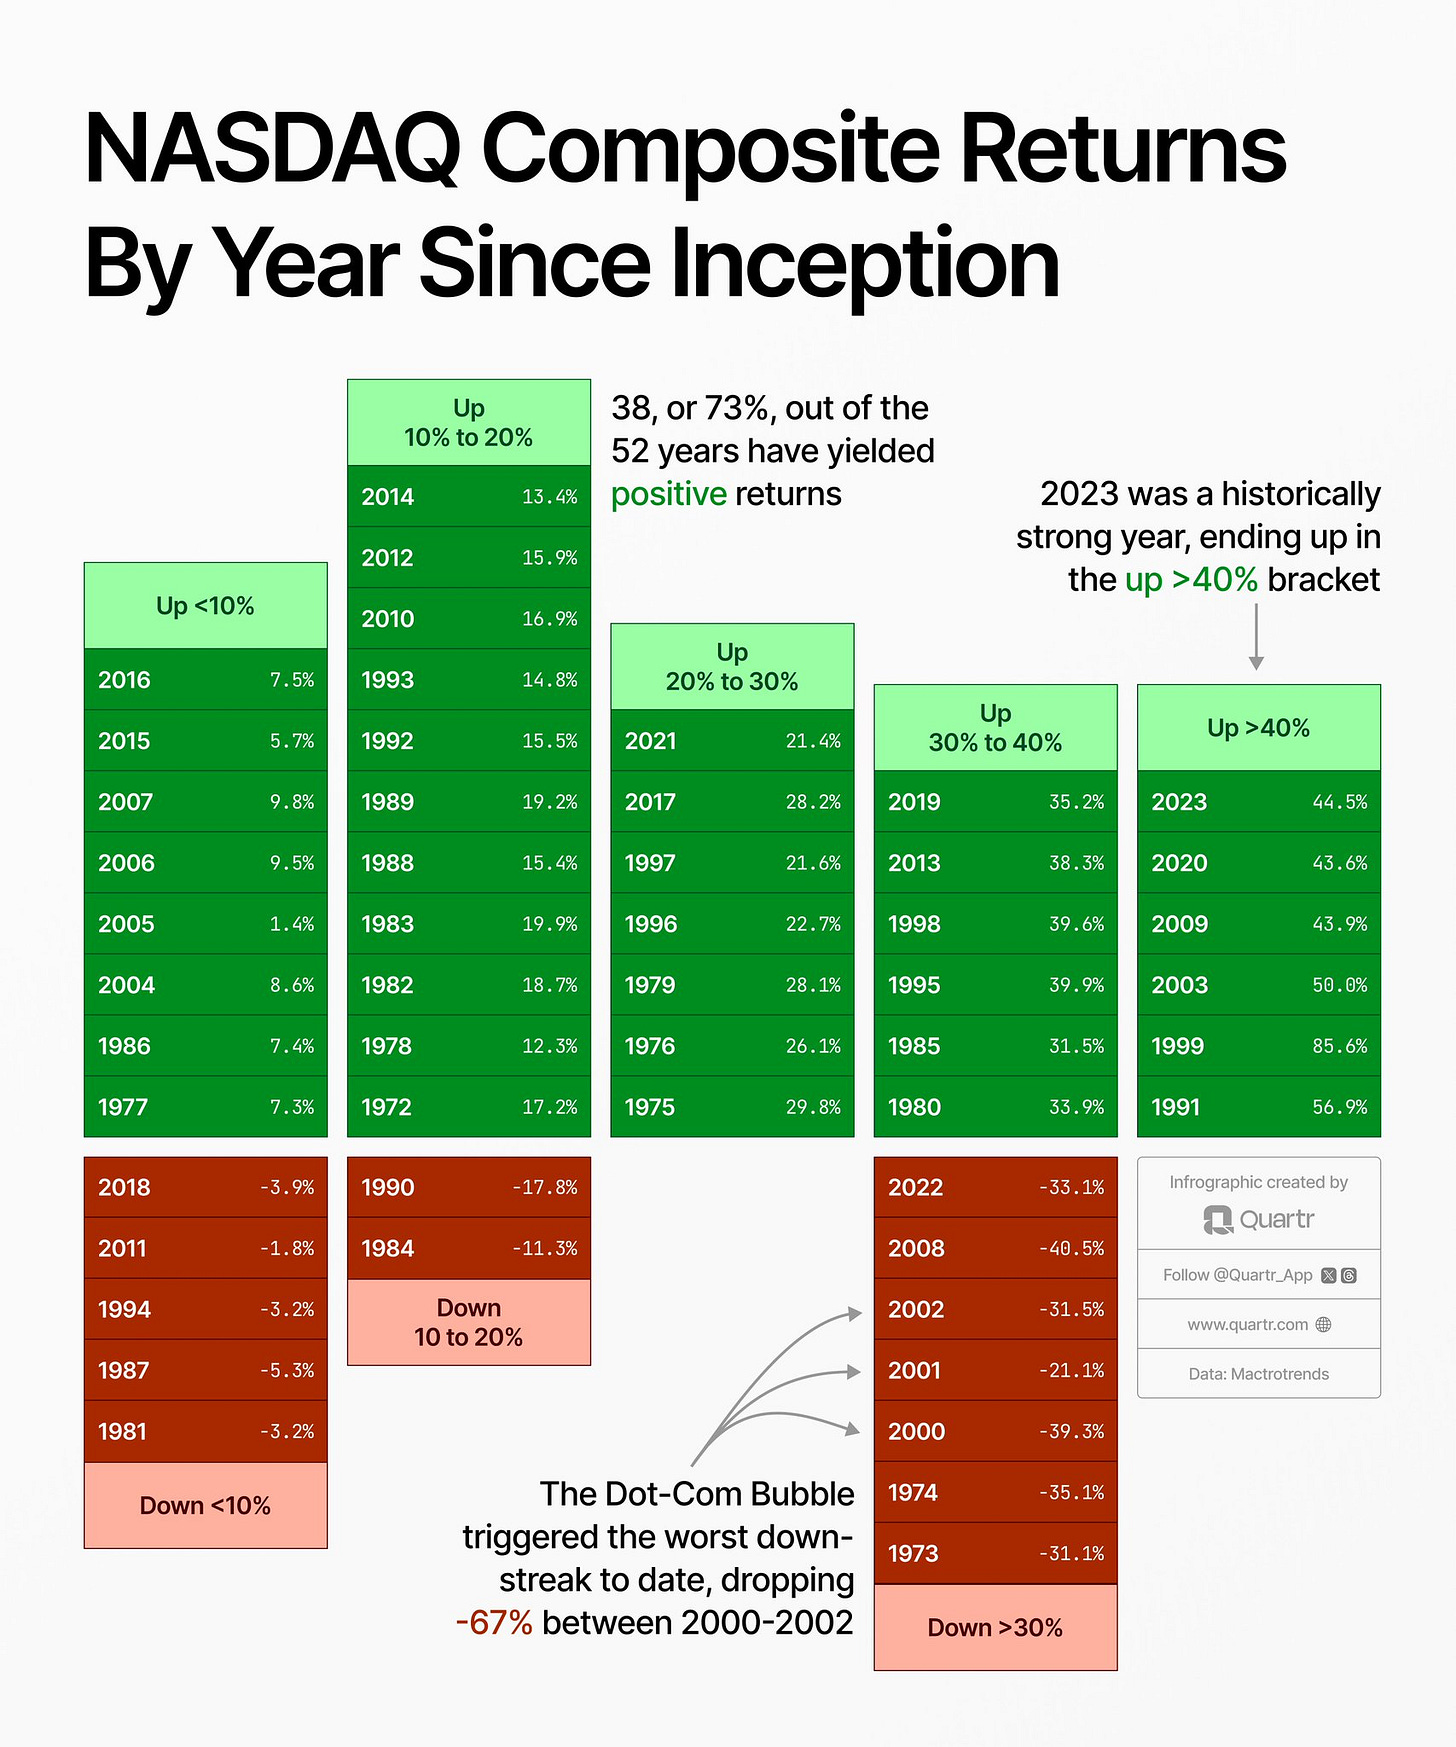
2023 was one of the best years ever for the Nasdaq, but as you can see the odds are always in the favor of the bulls with 3x more green years than red years over the past 50+ years…
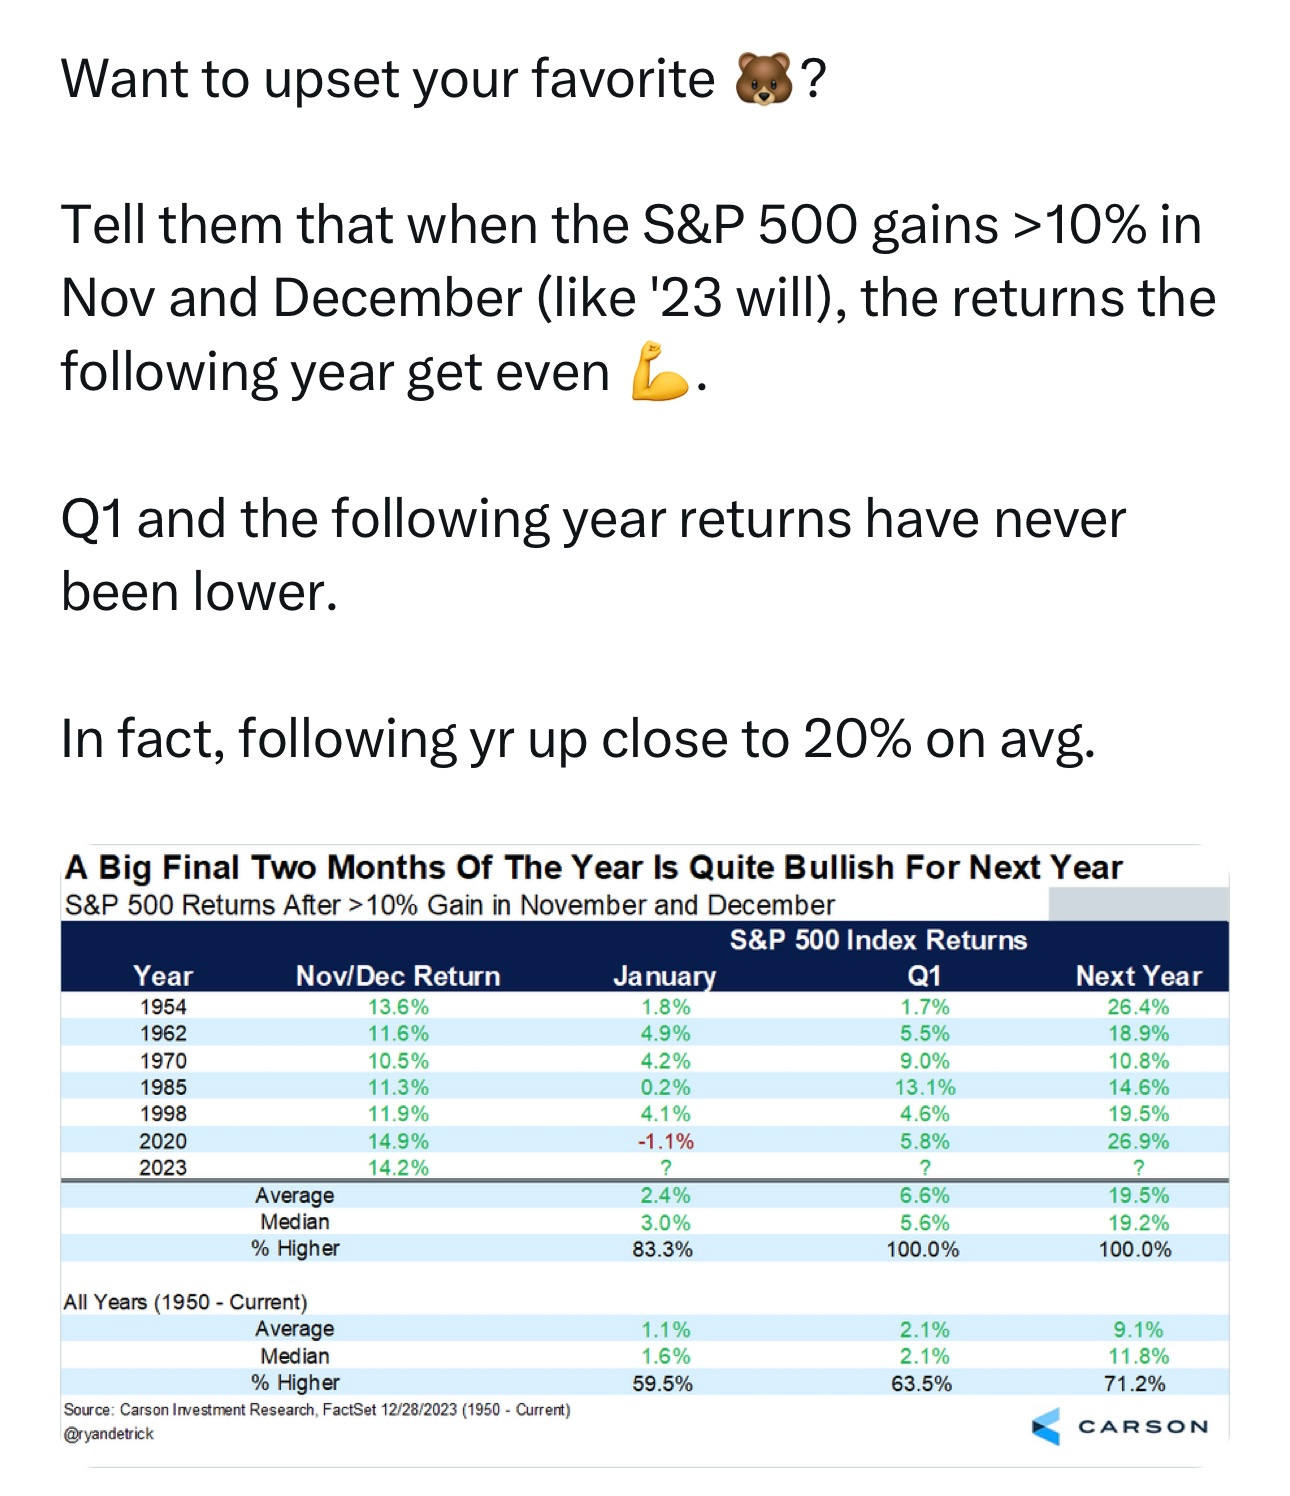
History says that 2024 could be a good year for stocks…
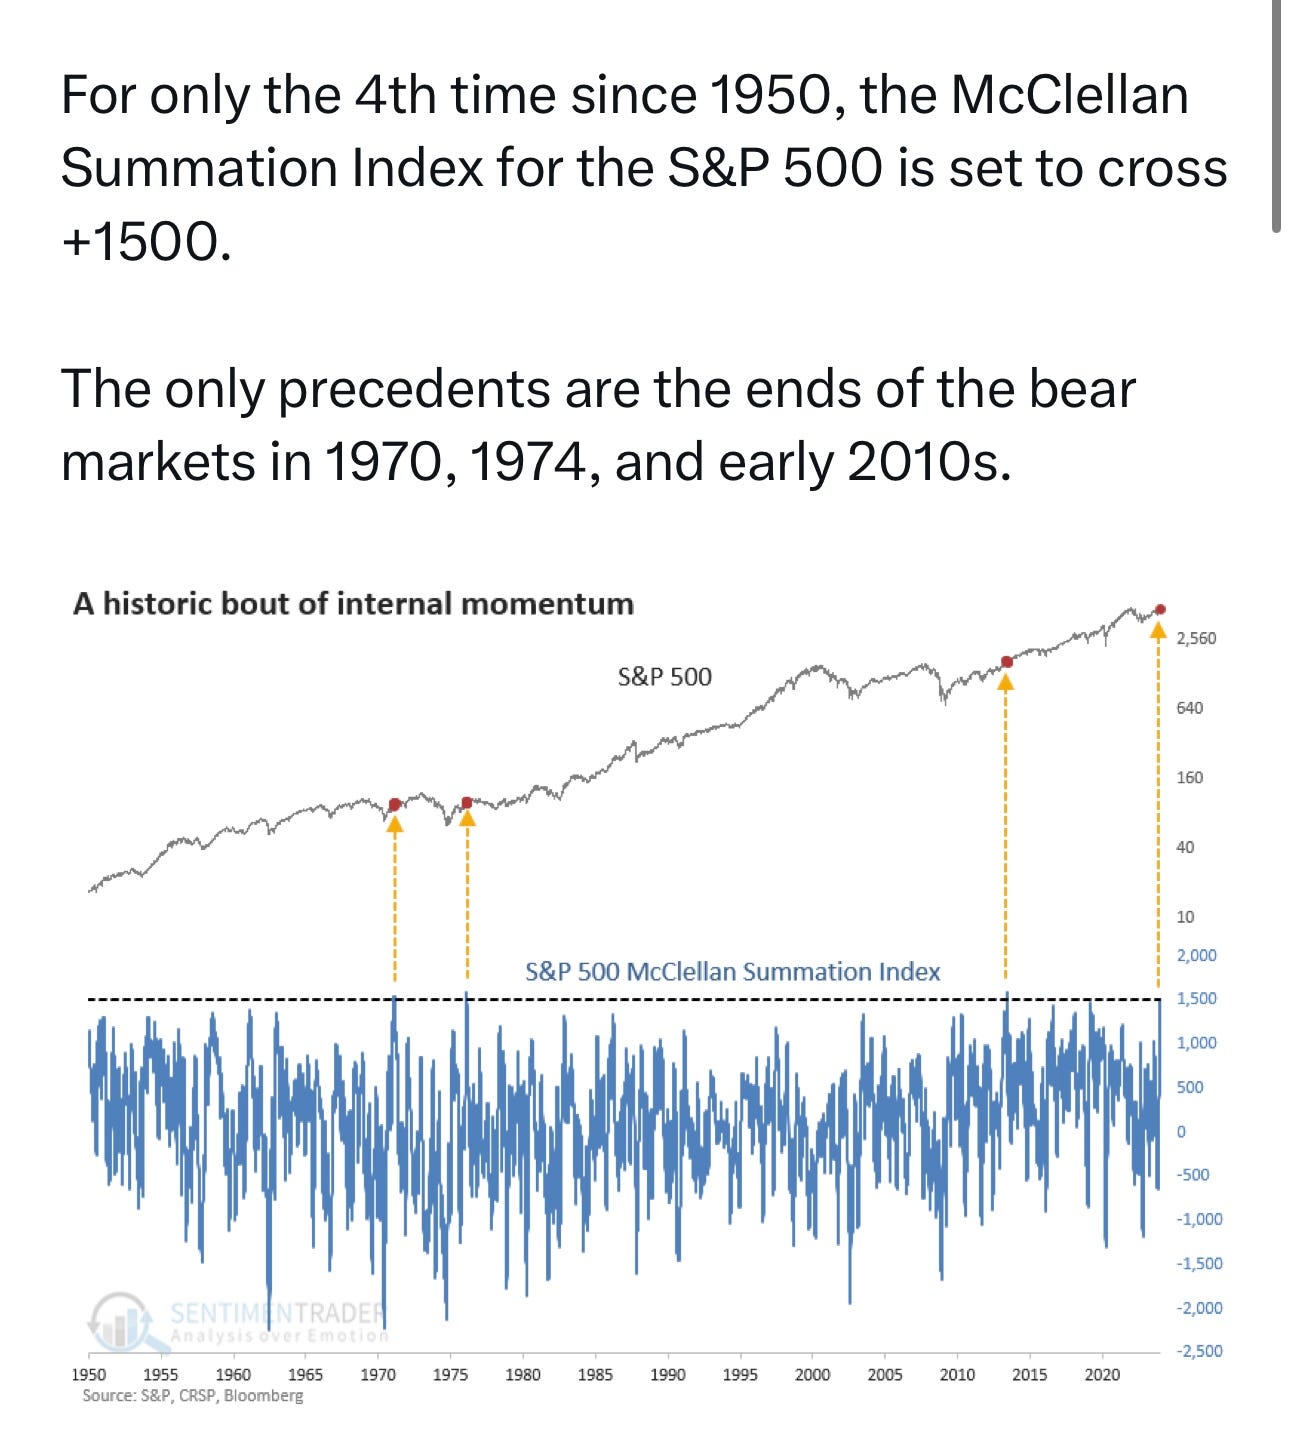
Even the McClellan Summation Index is showing signs that a big bull market is on the way…
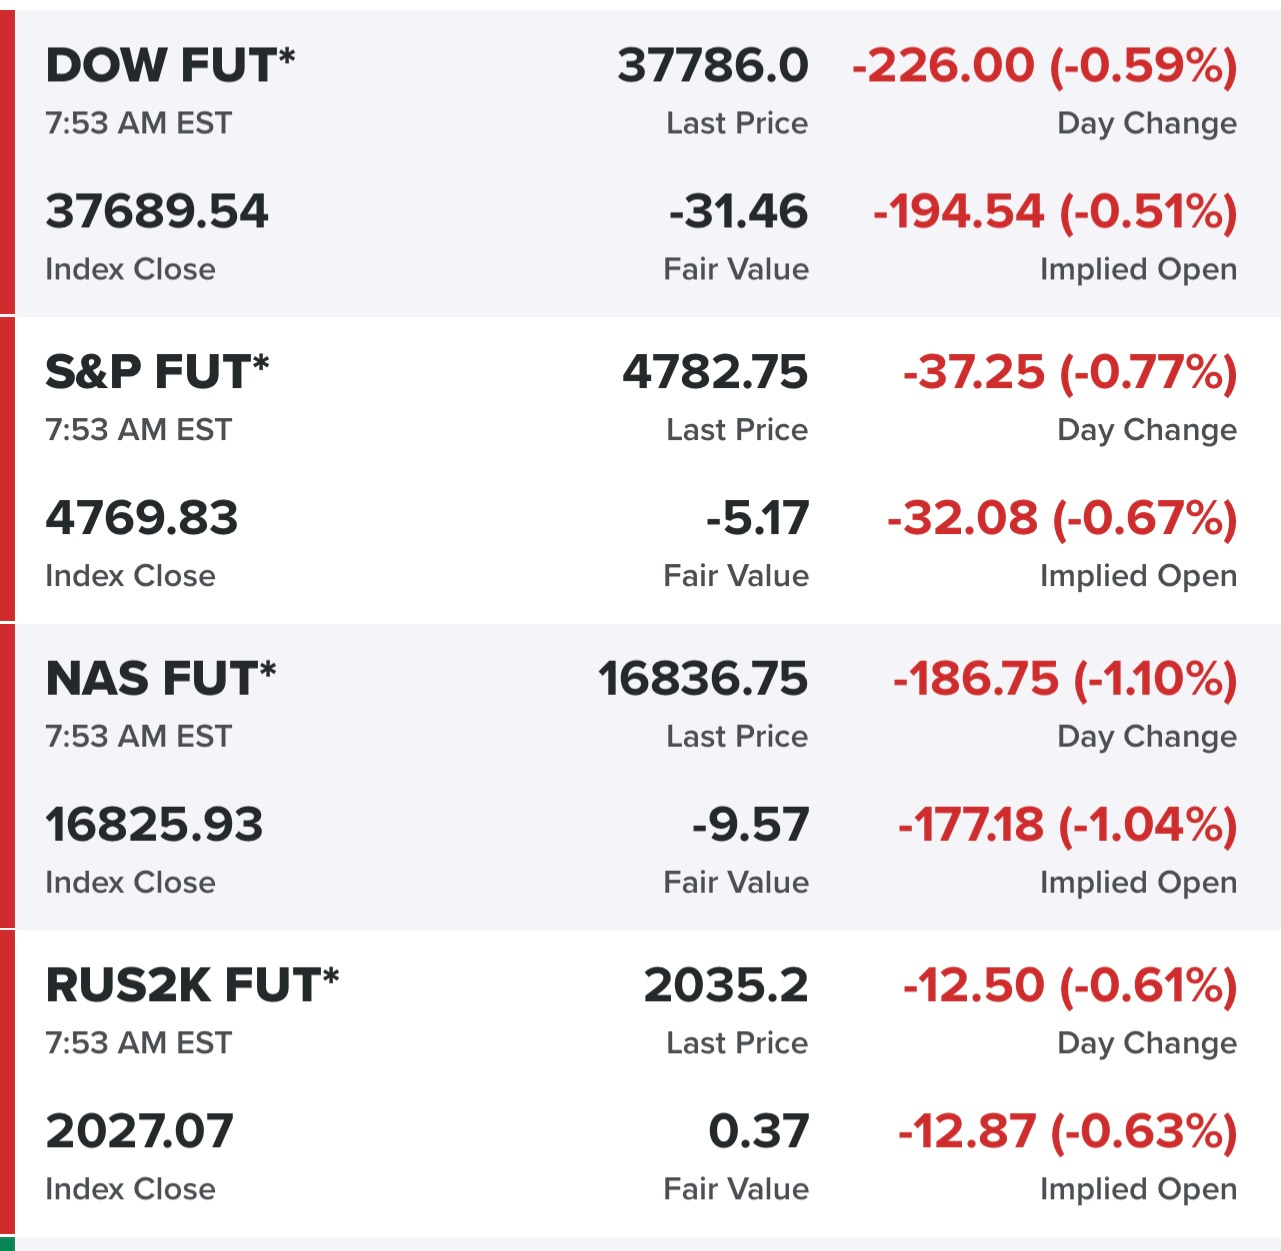
Equity futures…
Indexes from yesterday…
Sectors from yesterday…
Rates…
New highs vs new lows…
Market performance…
$TNX (10Y Treasury)
$VIX
$CL1! (Oil)
$SPX (S&P 500)
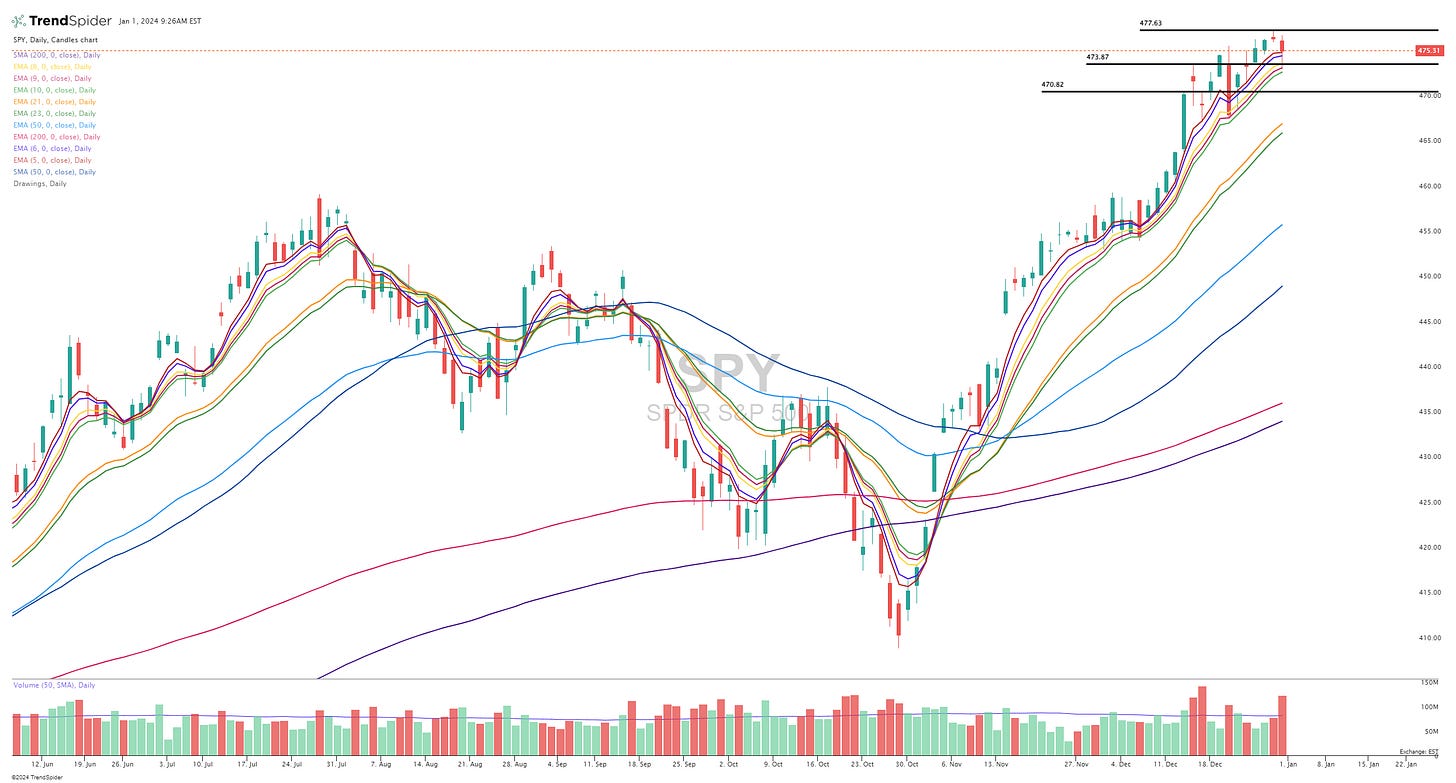
SPY (S&P 500, market cap weighted)
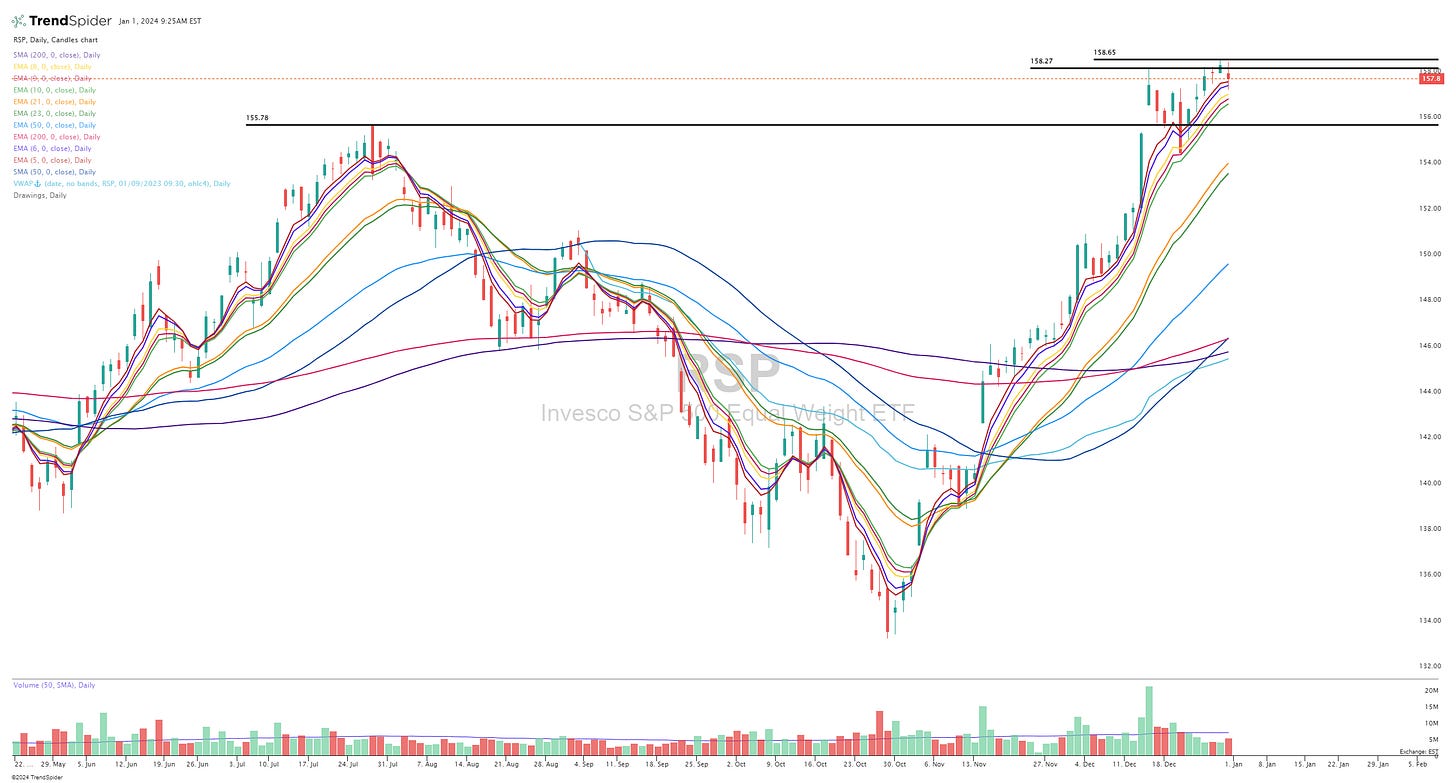
RSP (S&P 500, equal cap weighted)
QQQ (Nasdaq 100, market cap weighted)
QQQE (Nasdaq 100, equal cap weighted)
IWM (Russell 2000, small/mid caps)
IWO (Russell 2000 Growth, small/mid caps)
ARKK (Ark Innovation ETF)
FFTY (IBD Innovator ETF)
Finviz screen #1: ACAD AFRM ALKS APO APP ASAI ASPN ATEC AXNX AXSM AZEK AZTA AZUL BIRK BKR BORR BROS BRZE CCJ CCL CELH CLSK COUR CPRX CRS CRWD CUK CWAN CYBR DASH DHT DKNG DLO DUOL EDU EQH ERJ ESMT EVH FLNC FLS FOLD FOUR FRPT FTAI GENI GGAL GLBE GS GTLB HBM HIMS HLX HOOD IMGN INDI IOT ITCI KKR KTOS LAUR LFST LI LLY LSPD LYV MDXG META MIRM NBIX NCLH NE NEOG NOW NTRA NTST NU NVDA NVO NVTS OKTA OLK OSCR PAAS PCOR PDD PGNY PGR PR RCL RIVN RNW ROVR RYAAY RYTM S SFL SG SHAK SHOP SMAR SNOW SOFI SPT SQ STNE SYM TAL TDW TEAM TGTX TMDX TRUP TWO U UBS USAC WT XP ZETA ZS
Criteria: stock price above $5, market cap above $1 billion, above 200d sma, average daily volume above 500k, sales growth above 20%, earnings growth above 20%
Finviz screen #2: ACAD ACIW ADC AFRM AGI AJG ALHC ALKS ALLY AMP ANET ANF APAM APO APP ARCO ARDX AROC ASAI ASML ASND ASPN ATEC AVDX AVPT AX AXNX AXP AXS AXSM AZEK AZTA AZUL BAH BANC BBIO BBVA BIRK BK BKR BMO BMRN BNS BORR BRBR BRKR BRO BROS BRP BRZE BZ C CCJ CCL CE CELH CIEN CLBT CLSK CM COF COLB CORT COTY COUR CP CPRX CRS CRWD CTKB CUK CWAN CX CYBR DASH DB DCPH DDOG DFS DHT DKNG DLO DOCN DT DUOL DV DXCM EBR EDU ELF EPR EQH ERJ ESMT ESTC EVH EXR FCF FIVN FLNC FLS FOLD FOUR FRO FROG FRPT FRSH FSLY FTAI FTI FUTU GEN GENI GGAL GLBE GNTX GS GTLB HASI HBM HDB HIMS HLX HOOD HOPE HQY HUBS HWM IBN IMGN INDI INSM IOT ITCI ITUB KEY KKR KTOS LAUR LFST LGF-A LGF-B LHX LI LLY LMND LPLA LSPD LULU LW LYV MBLY MC MCO MDB MDLZ MDXG META MFC MGA MGM MIR MIRM MMYT MNDY MRTX MS MU MUFG NBIX NCLH NCNO NE NEO NEOG NET NOV NOVA NOW NTNX NTRA NTST NU NVDA NVO NVT NVTS NXT O OKTA OLK OSCR OSK OSW OTEX OWL OZK PAAS PANW PATH PB PCOR PDD PFS PGNY PGR PLTR POST PR PSN PWR RBA RBLX RCL REXR RIVN RKT RNW ROIV ROK ROKU ROL ROP ROVR RRX RXST RY RYAAY RYTM S SAFE SBS SCCO SFL SG SHAK SHOP SMAR SMFG SMPL SNOW SNPS SOFI SOVO SPOT SPT SQ SQSP STNE STT STWD SYF SYM TAL TCOM TD TDW TEAM TENB TEX TGI TGTX TMDX TREX TRIP TRNO TRUP TWO TWST TXG U UBS UCBI UDMY URI USAC USB VCYT VICI VIV VOYA VRT VVV WAB WAL WBS WDAY WFRD WHD WT XP XPEV XYL YMM ZETA ZS
Criteria: stock price above $5, market cap above $1 billion, above 200d sma, average daily volume above 500k, sales growth above 15%, earnings growth above 0%
Below the paywall is my:
morning commentary
daily watchlists with charts
link to current trading portfolio with all positions, entry prices and stop losses
links to my daily webcasts and all previous webcasts
YTD trading stats and performance

